


 11 / 61

CARDIOVASCULAR JOURNAL OF AFRICA • Volume 32, No 4, July/August 2021
AFRICA
183
(a creatinine value of 1.5 mg/dl or above). Three different stent
graft systems were used for EVAR, Medtronic (Endurant II
Stent Greft), Jotec (E-vita abdominal Stent Greft) and Lifetech
(Ankura AAA Stent Greft) brand devices.
Reconstructive volumetric measurements were performed
to assess total aneurysm volume (TAV), patent lumen volume
(PLV) and thrombus-coated aneurysm wall volume (TCAWV).
In addition, individual measurements were performed at the
proximal, distal and middle sections of the aneurysm. The
impact of pre-operative thrombus load and the brand of the
stent device on volumetric regression were also examined.
The impact of pre-operative thrombus load on TAV change
was examined at three different postoperative periods. To do this,
the median TCAWV value was measured pre-operatively (131
cm
3
) and used as a threshold, and patients who were below or
above the threshold were divided into two groups. Postoperative
TAV was then measured at three different time points in the two
patient groups.
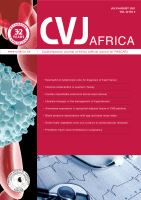
TAV was determined as the total volume of the aortic
segment starting from the distal end of the left renal artery to the
distal iliac bifurcation. PLV was the open lumen volume through
which blood passed. TCAWV was defined as the total thrombus
volume smeared on the aneurysm wall between the aneurysm
outer wall and the patent lumen (Fig. 1A, B). The measurements
were performed with the Syngo.via software (VB20B version;
Siemens Health, Erlangen, Germany), which was integrated
with the PACS imaging system belonging to the Department of
Radiology of our hospital. The measurements were carried out
jointly by a radiologist and a cardiovascular surgeon.
Reconstructive volumetric TAV measurements were
performed as follows: after the axial section scan was opened
and enlarged in ‘MM reading’ mode, axial sections were taken
at 3-mm intervals starting from just below the left renal artery
outlet to the beginning of the distal iliac artery bifurcation, and
the image borders were drawn manually. Then the software’s
‘create voi’ feature combined semi-automatically drawn segments
to make a three-dimensional reconstruction that provided the
volume of the three-dimensional structure in cm
3
(Fig. 2A, B).
In some patients, tortuous areas were present in the sagittal
and coronal sections. While creating the reconstruction, in
areas with aortic tortuousity, measurements were made with
1-mm slices instead of 3 mm in the axial sections. For each
TAV measurement, a three-dimensional view was obtained
by reconstructing axial sections taken from 30 to 40 different
segments, depending on the aneurysm length.
A low molecular-weight heparin (Enoxaparin, 1 mg/kg every
12 hours) was administered to patients for one or two days
following the surgery. After hospital discharge, clopidogrel
(75 mg/day), acetylsalicylic acid (100 mg/day) and a
β
-blocker
(50–100 mg/day) were prescribed. At the six-month follow up,
clopidogrel was terminated and the patients were continued on
acetylsalicylic acid and a
β
-blocker.
Statistical analysis
For continuous variables, mean and standard deviation are used
as descriptive statistics. Likewise, for categorical variables, number
and percentage are provided. The changes of numerical variables
over time were compared using mixed-effects models. Multiple
comparisons were performed using Dunnett’s adjustments.
Analyses were performed using SAS University edition 9.4. A
p
-value < 0.05 was considered statistically significant.
Results
The mean age of patients was 66.9 years (range 61–73). A total
of 158 CTA scans was examined pre-operatively (
n
= 52), and six
(
n
= 49), 12 (
n
= 35) and 24 months postoperatively (
n
= 22). In
two patients, a type 1 endoleak was detected and in four, a type 2
endoleak. In nine patients (17%), sac enlargement was observed
compared to the pre-operative period. Demographic data of
patients are provided in Table 1.
Mean TAV had regressed at six (
p
= 0.1), 12 (
p
= 0.0003) and
24 months (
p
= 0.0008) compared to the pre-operative period
(Fig. 3). Mean TCAWV had increased at six months (
p
= 0.3),
while it had regressed at 12 (
p
= 0.3) and 24 months (
p
= 0.8)
compared to the pre-operative period (Fig. 4). Mean PLV had
regressed at six (
p
= 0.008), 12 (
p
= 0.0002) and 24 months (
p
=
0.0006) compared to the pre-operative period (Fig. 5).
Mean proximal measurements suggested a regression at
six (
p
= 0.4), 12 (
p
= 0.08) and 24 months (
p
= 0.1) compared
to the pre-operative period (Fig. 6). Likewise, mean middle
measurements demonstrated a regression at six (
p
= 0.2), 12 (
p
= 0.007) and 24 months (
p
= 0.1) compared to the pre-operative
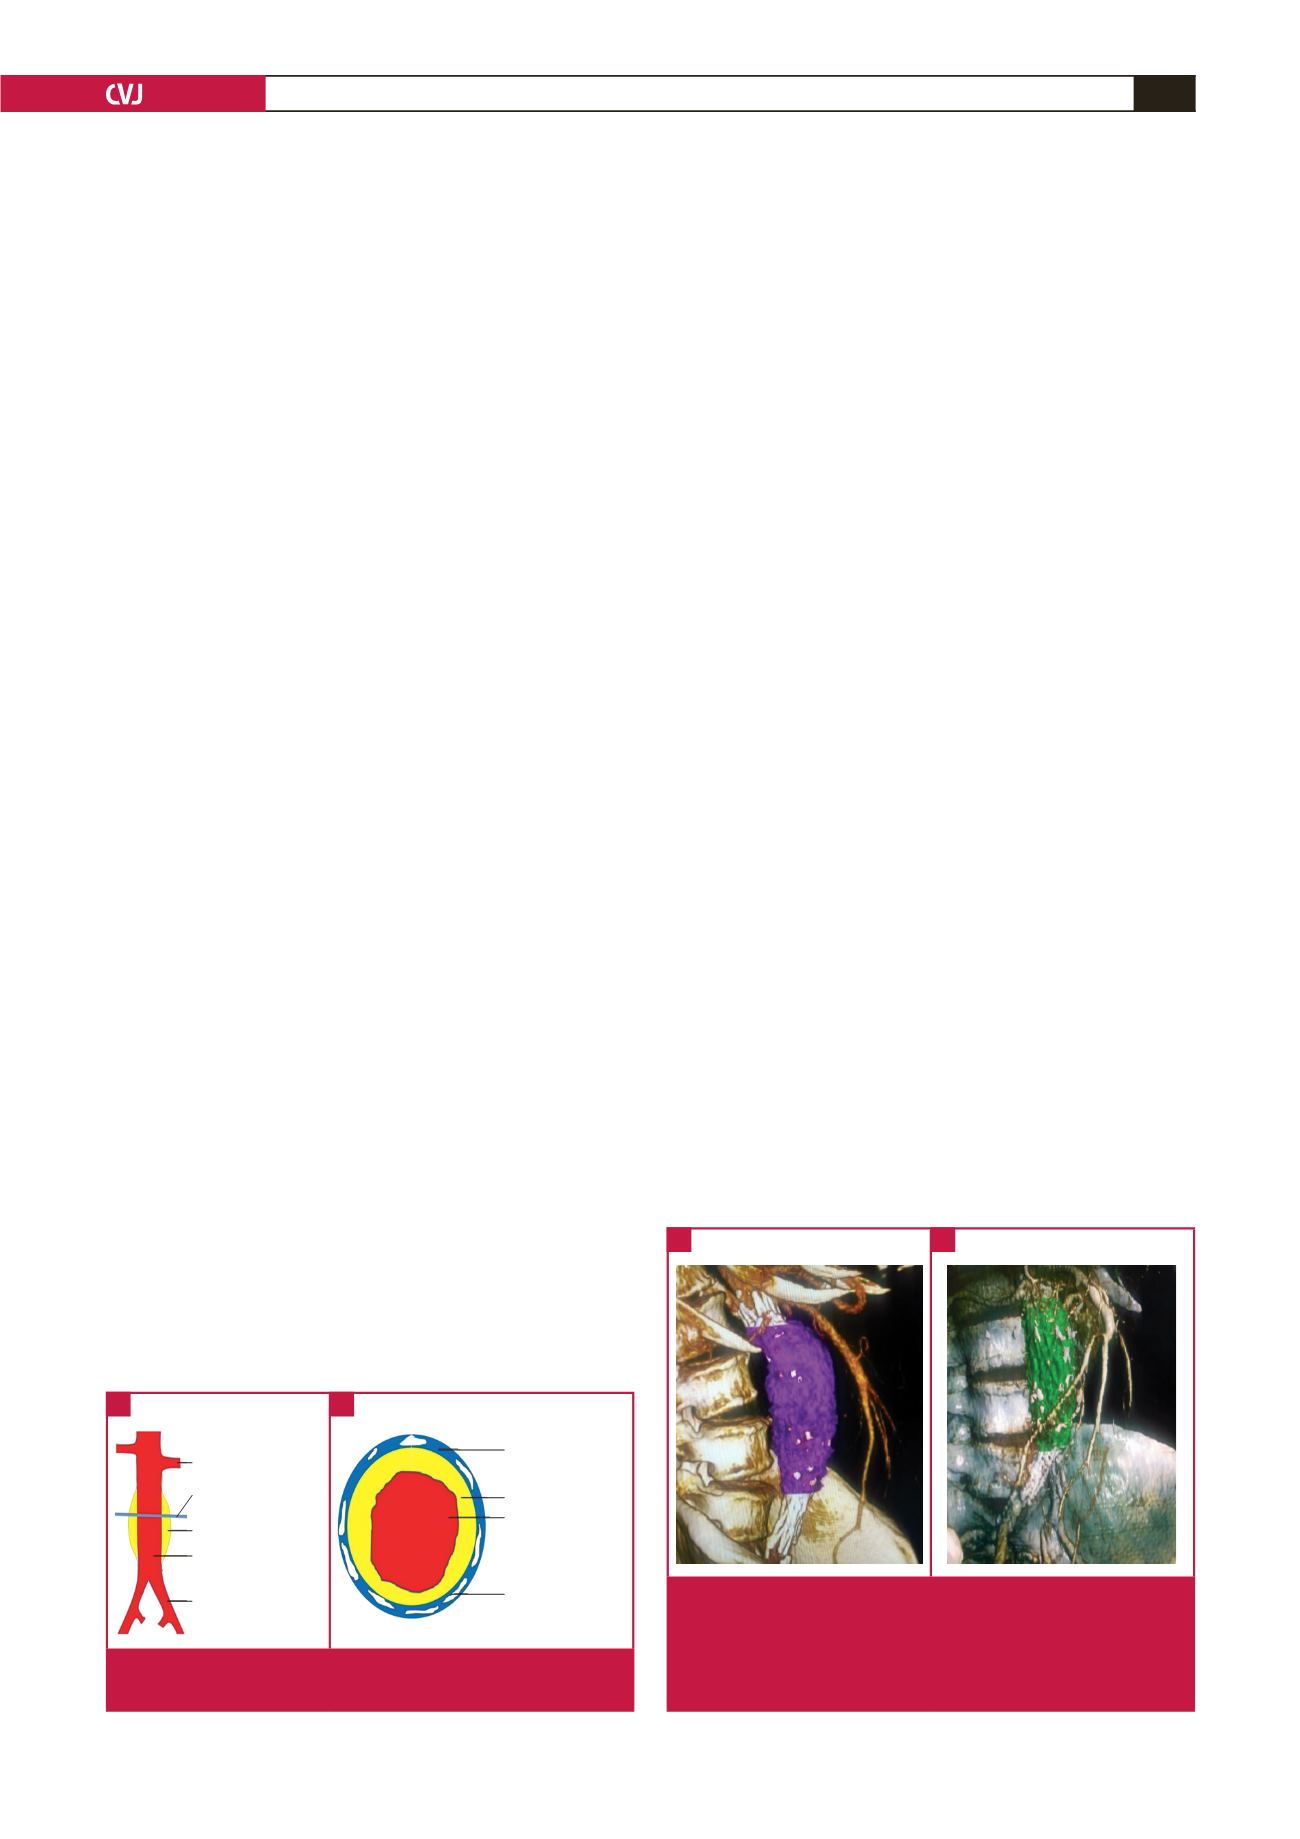
Fig. 2.
A. Lateral view of the TAV obtained by reconstructive
volumetric measurement in the 12th month postop-
eratively. B. Oblique view of PLV obtained by recon-
structive volumetric measurement in the 12th month
postoperatively.
A
B
Left renal artery
Transverse plane
Thrombus-covered
aortic wall
Patent lumen
Left iliac artery
Arterial wall
Thrombus-covered
aortic wall
Patent lumen
Calcification
Fig. 1.
A. Components of an AAA. B. Transverse plane image
of an AAA.
A
B