


 12 / 61

CARDIOVASCULAR JOURNAL OF AFRICA • Volume 32, No 4, July/August 2021
184
AFRICA
period (Fig. 7). Mean distal measurements had also regressed at
six (
p
= 0.3), 12 (
p
= 0.001) and 24 months (
p
= 0.0004) compared
to the pre-operative period (Fig. 8). Volume measurements
of patients taken at three different postoperative time points
compared to the pre-operative period are provided in Table 2.
In the high pre-operative TCAWV (> 131 cm
3
) group,
postoperative TAV at six (
p
= 0.008), 12 (
p
< 0.0001) and 24
months (
p
= 0.0004) were significantly different. On the other
hand, in the low TCAWV group, no significant change was
observed (Fig. 9).
Three different stent graft systems were used for EVAR. In
32 patients, Medtronic (Endurant II Stent Greft) was used, eight
patients had Jotec (E-vita abdominal Stent Greft) devices, and
in 12 patients, Lifetech (Ankura AAA Stent Greft) devices were
used. The impact of these three different devices on volumetric
regression was investigated, but no significant differences were
found.
Five patients died during the study, seven, 10, 12, 13 and 18
months postoperatively. The causes of death were found to be
due to co-morbidities. Four patients had hypertension, three had
coronary artery disease, three had chronic lung disease, and one
had both coronary artery and chronic lung disease.
Discussion
In order to detect potential complications that may develop
following EVAR, CTA follow up is suggested at one, six and 12
months postoperatively. In patents without any complications,
lifelong annual CTA follow up is recommended.
3-5
Moreover,
Table 1. Demographic data
Demographic characteristics
Patient number (
n
= 52)
%
Gender: female/male
4/48
8/92
Hypertension
23
44
Coronary artery disease
22
42
Cigarette smoking
37
71
Chronic obstructive pulmonary disease
18
34
Peripheral artery disease
10
19
Diabetes
8
15
Cerebrovascular disease
8
15
History of malignancy
6
11
Chronic renal failure
4
7
Body mass index, kg/m
2
27.8 (23–39.5)
Table 2.The change in aneursym volume measurement over time
Volume
Pre-operative,
cm
3
6th month,
cm
3
(%)
12th month,
cm
3
(%)
24th month,
cm
3
(%)
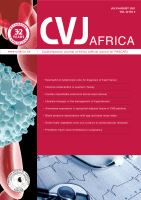
TAV
276
254 (7)
201 (27)
222 (19)
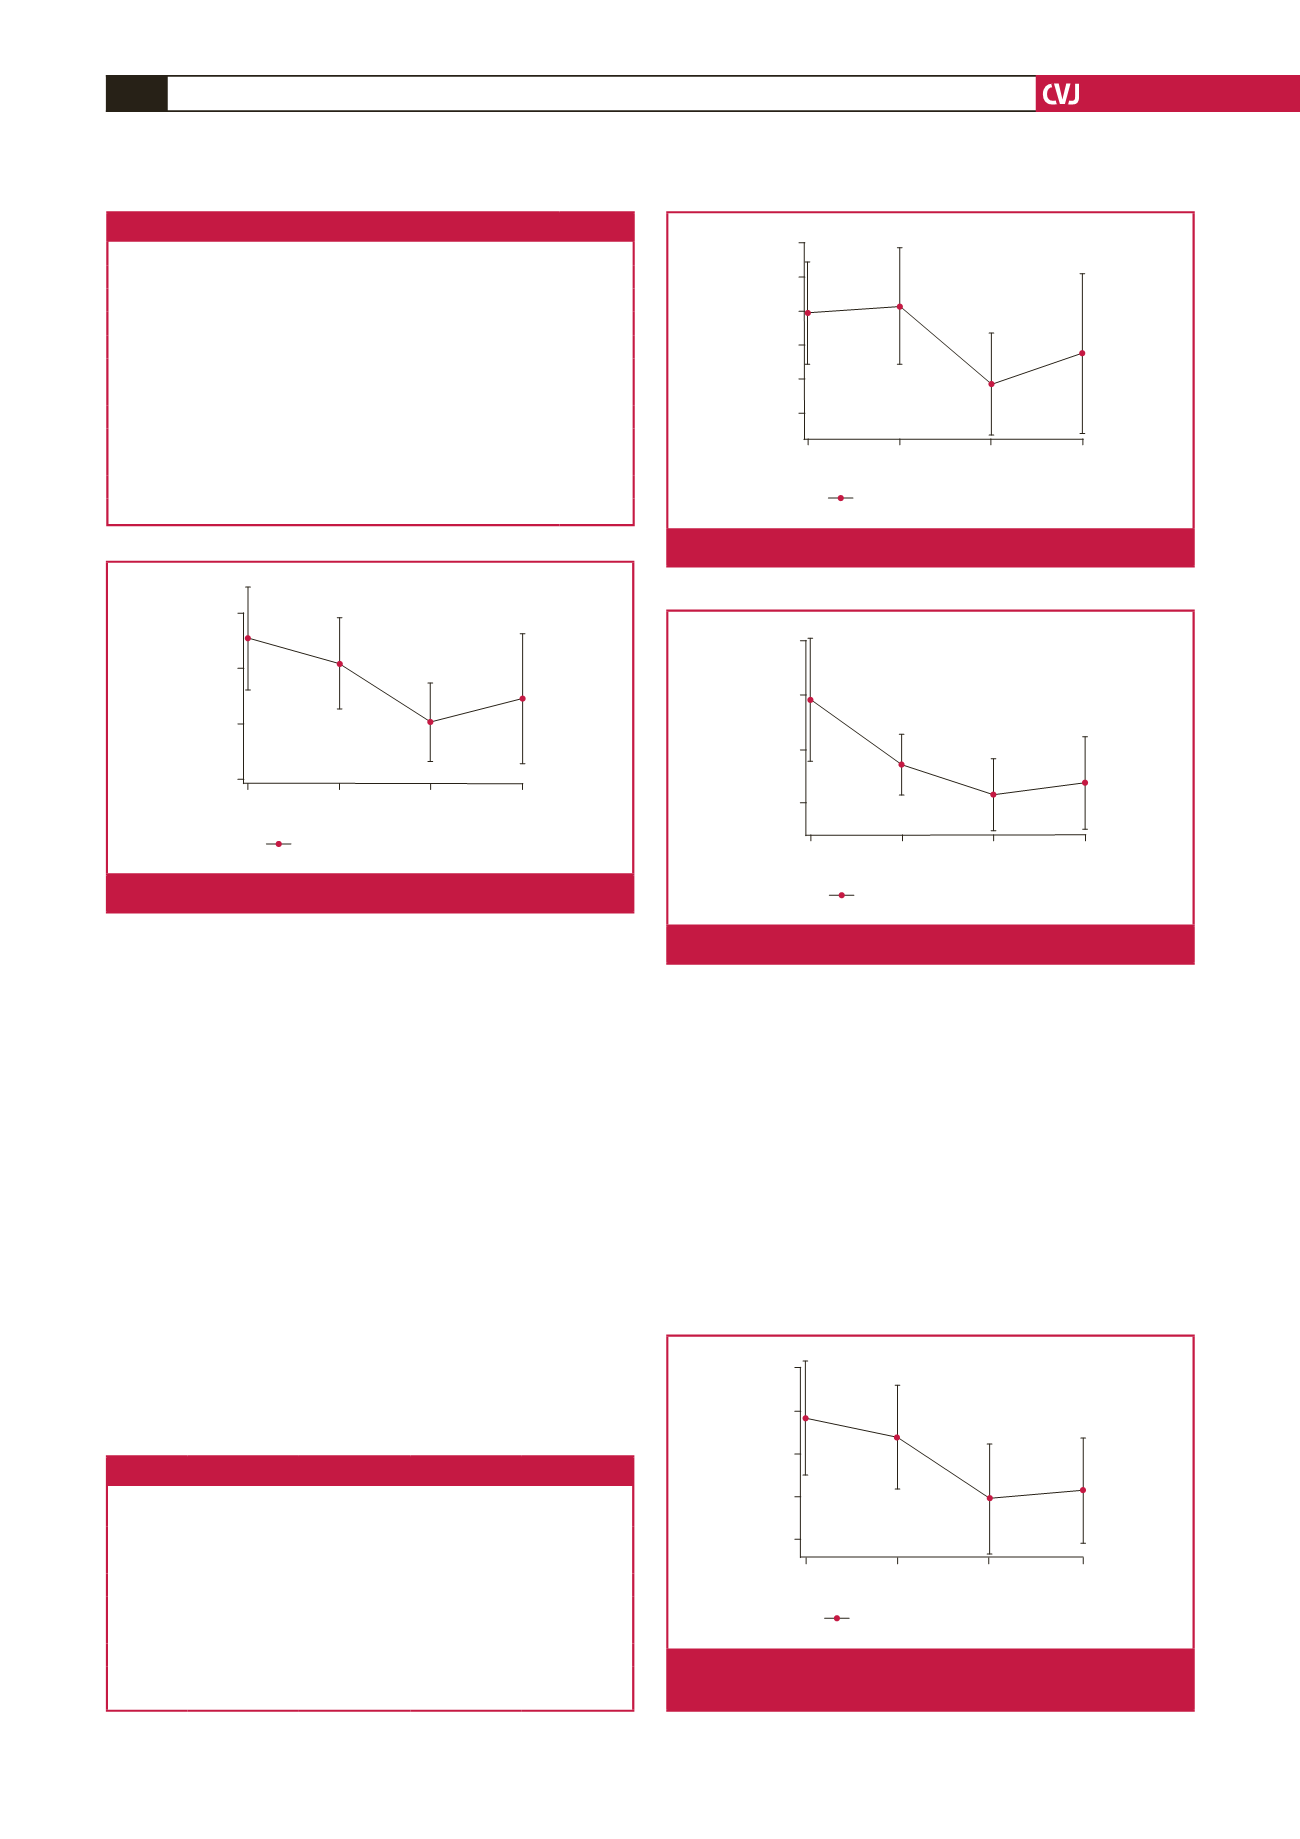
TCAWV
158
162 (2)
116 (26)
135 (14)
PLV
118
94 (20)
83 (29)
87 (26)
Proximal
34
32 (6)
24 (27)
25 (24)
Distal
59
53 (10)
42 (28)
47 (21)
Middle
182
168 (7)
131 (27)
149 (18)
TAV: total aneursym volume, TCAWV: thrombus-covered aortic wall volume,
PLV: patent lumen volume.
300
250
200
150
TAV (mean)
Pre-op Month 6 Month 12 Month 24
Time
Mean. 95% confidence limits
Fig. 3.
The change in mean TAV over time.
140
120
100
80
PLH (mean)
Pre-op Month 6 Month 12 Month 24
Time
Mean. 95% confidence limits
Fig. 5.
The change in mean PLV over time.
160
180
200
140
120
100
TCAWV (mean)
Pre-op Month 6 Month 12 Month 24
Time
Mean. 95% confidence limits
Fig. 4.
The change in mean TCAWV over time.
20
25
30
35
40
Proximal (mean)
Pre-op Month 6 Month 12 Month 24
Time
Mean. 95% confidence limits
Fig. 6.
The change in the proximal 2-cm portion of the mean
aneurysm sac volume over time.