CARDIOVASCULAR JOURNAL OF AFRICA • Vol 24, No 8, September 2013
AFRICA
333
The most prevalent lipid disorder (either alone or in
combination) in very high-risk patients was above-target LDL-C
levels (60.1%), followed by elevated TG levels (45.8%), and
low HDL-C levels (36.0%). By contrast, in both high- and
moderate-risk patients, elevated TG levels were observed more
frequently (46.7 and 40.1%, respectively in the two risk groups)
than above-target LDL-C levels (33.3 and 24.1%, respectively)
and low HDL-C levels (25.0 and 26.3% for both risk groups,
respectively).
We next performed a sub-analysis of lipid abnormalities for
only very high-risk patients (756 of all patients, Table 3), which
we stratified as indicated. Of those with CVD and DM, 57.9%
displayed off-target LDL-C levels (
≥
1.8 mmol/l and a decrease
in LDL-C levels of
<
50%), 39.7% showed low HDL-C levels,
and 54.2% had elevated TG levels. In comparison, patients in
the CVD without DM group showed a higher rate of LDL-C
not at target (68.0%), decreased rates of low HDL-C (33.8%),
and elevated TG levels (38.2%). Interestingly, the ESC SCORE
group with risk of
≥
10% showed a lower proportion of patients
with low HDL-C and elevated TG levels. Overall, we found that
LDL-C not at goal was the most common lipid abnormality
observed in each of the four sub-sets.
Additionally, we analysed patient lipid abnormalities using
kernel density curves for the empirical distributions of very high-
risk and non-very high-risk patient groups with regard to total
cholesterol, LDL-C, HDL-C (separately for men and women),
and TG levels (ESC guidelines indicated as superimposed
vertical lines) (Fig. 2). Overall, we found that the density curves
were unimodal and positively skewed, and the data indicated that
the very high-risk group showed slightly lower overall LDL-C
levels than non-very high-risk patients. Moreover, we observed
that women maintained higher overall HDL-C levels than men
in both the very high and non-very high-risk groups, while TG
levels were similar between the two risk groups.
Distributions of lipid abnormalities
Distributions of single and multiple combined lipid abnormalities
for our study are shown in Figs 3–5. Here, we present the joint
50
45
40
35
30
25
20
15
10
5
0
1
2
3
4
5
6
Statin dose potency
Percentage of patients
0.8
30.6
42.2
19.8
4.6
2.0
A
80
60
40
20
0
1
2
3
4
5
6
Statin dose potency
Percentage of patients
Caucasian
Asian
Black
Mixed ancestry
1.2
17.2
44.7
26.5
7.0
3.4
0.0
16.2
50.5
29.3
3.0
1.0
0.4
67.3
29.6
2.7
0.0
0.0
0.0
38.5
46.7
12.3
2.5
0.0
C
50
45
40
35
30
25
20
15
10
5
0
1
2
3
4
5
6
Statin dose potency
Percentage of patients
Non-very high risk
Very high risk
1.5 0.5
25.6
32.4
47.6
40.2
18.7 20.2
3.3 5.0 3.3 1.6
B
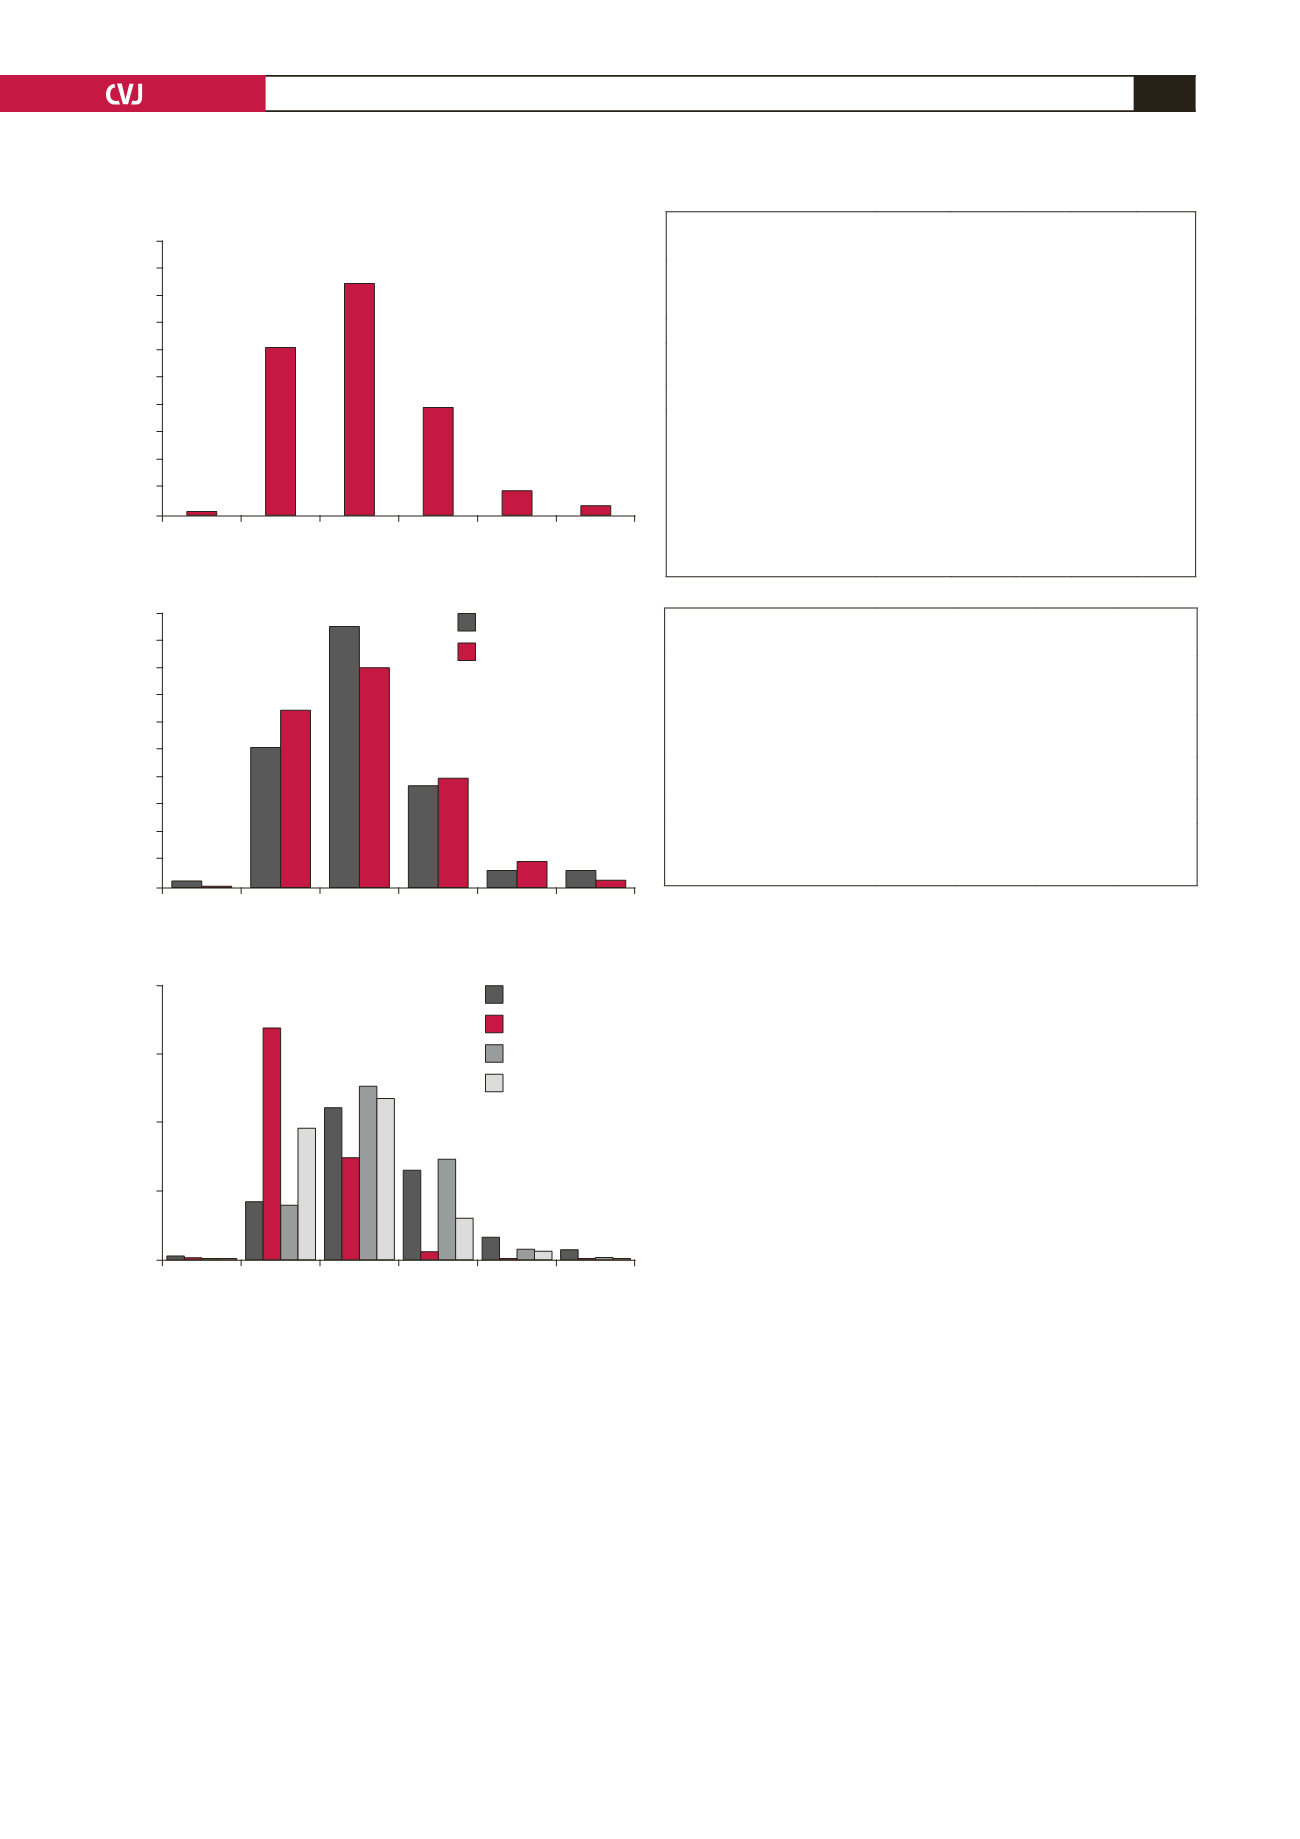
Fig. 1. Statin dose potency overall (A), according to
patients’ risk status (B), and by ethnicity (C) calculated
according to references 22, 23. *Statin dose potency 1 is
equivalent to simvastatin 5 mg/day, potency 2 is equiva-
lent to simvastatin 10 mg/day, potency 3 is equivalent to
simvastatin 20 mg/day, potency 4 is equivalent to simv-
astatin 40 mg/day, potency 5 is equivalent to simvastatin
80 mg/day, and potency 6 is equivalent to simvastatin
≥
160 mg/day.
TABLE 2. LIPIDABNORMALITIESACCORDINGTO ESC
GUIDELINES (2011) ON RISK STRATIFICATION
All
patients
(
n
=
1 029)
Very high
risk*
(
n
=
756)
High
risk
(
n
=
92)
Moderate
risk
(
n
=
139)
Low
risk
(
n
=
42)
LDL-C not at target (%)
†+
50.3
60.1 33.3 24.1
Low HDL-C [
<
1.0 (men)/1.2
(women) mmol/l) (%)
‡
33.7
36.0 25.0 26.3 34.1
Elevated TG (
>
1.7 mmol/l) (%)
§
45.3
45.8 46.7 40.1 50.0
*Very high risk
=
CVD, diabetes, and/or SCORE risk
≥
10% (chronic kidney disease
was not documented in DYSIS)
†
LDL-C
≥
3.0 mmol/l in patients with SCORE risk 1–4%, LDL-C
≥
2.5 mmol/l in
patients with SCORE risk 5–9%, LDL-C
≥
1.8 mmol/l in patients with CVD, DM,
and/or SCORE risk
≥
10%; LDL-C
≥
1.8 mmol/l
+
Data on 987 patients were available
‡
Data on 1 025 patients were available
§
Data on 1 027 patients were available
In the ESC 2011 guidelines, no LDL-C goal was specified for the low-risk group.
TABLE 3. LIPIDABNORMALITIESACCORDINGTO ESC
GUIDELINES (2011) INVERY HIGH-RISK PATIENTS
CVD +
DM
(
n
=
131)
CVD
(w/o DM)
(
n
=
241)
DM
(w/o CVD)
(
n
=
285)
SCORE
≥
10%
(
n
=
99)
LDL-C
≥
1.8 mmol/l and
LDL-C reduction
<
50% (%)*
57.9
68.0
53.8
61.9
Low HDL-C [
<
1.0 (men)/1.2
(women) mmol/l] (%)
†
39.7
33.8
37.9
31.3
Elevated TG (
>
1.7 mmol/l) (%)
‡
54.2
38.2
51.9
35.4
*Data on 722 of a total of 756 high-risk patients were available
†
Data on 755 patients were available
‡
Data on 756 patients were available.


