CARDIOVASCULAR JOURNAL OF AFRICA • Vol 24, No 8, September 2013
AFRICA
323
the Declaration of Helsinki. Individuals were informed about
the aims, procedures and possible risks of the study and gave
informed, written approval.
Inclusion criteria were clinically diagnosed coronary artery
disease requiring coronary artery bypass operation (CABG), age
between 41 and 70 years and body mass index
>
25 kg/m
2
. Thirty
patients with coronary artery disease undergoing CABG were
included in this study. Patients were randomly divided into two
groups, the control and LA treatment group.
Data obtained from 15 patients who were operated on in the
standard manner were evaluated in the control group (
n
=
15;
eight males, seven females; mean age 63.43
±
6.12 years, range
41–69 years). During the same dates, another 15 patients who
had undergone coronary bypass surgery and received LA in the
prime solution of the cardiopulmonary bypass were evaluated
within the LA group (
n
=
15; seven males, eight females; mean
age 61.16
±
4.72 years, range 42–70 years).
Blood samples (10 ml) were taken 24 hours before (P1),
and one (P2), four (P3), 24 (P4) and 48 hours (P5) after the
operation. Five blood samples were taken from each patient by
venipuncture. The mean follow-up time for all patients was 24
±
9.4 months (range 12–48 months). Patients were followed post-
operatively after the first month, and then every six months.
Levels of IL-6 and IL-8 were evaluated by enzyme-linked
immunosorbent assay (ELISA) using PeliKine compact human
ELISA (Amsterdam, Netherlands) kits according to the
manufactuter’s instructions. Results are presented in pg/ml. C3
and C4 levels in the serum were analysed nephelometrically
with Dade Behring C3 and Dade Behring C4 kits (Marburg,
Germany) using a Behring nephelometer 100 (Illinois, USA).
Results are presented in g/l.
C-reactive protein (CRP) and anti-streptolysin O (ASO) levels
were analysed with the Schiapparelli biosystems (Columbia,
USA) turbidimetric method. Results are presented in IU/ml for
ASO and mg/l for CRP as described elsewhere.
9
Haptoglobin
levels were evaluated with the Space Schiapparelli Inc (Columbia,
USA) turbidimetric method, and results are given in g/l.
Statistical analysis
Data are expressed as means
±
SEM of the numbers of analyses.
Statistical significance was analysed using the SPSS program
(SPSS, 10.0; Inc, Chicago, IL, USA). To compare the difference
between groups, statistical significance was calculated by the
Mann–Whitney
U
-test with Spearman rank order correlation test.
A
p
-value lower than 0.05 was defined to indicate statistically
significant differences.
Since the ECC circuit causes haemodilution, correction
was done according to the haematocrit for concentrations of
cytokines obtained by the ELISA method. A correction factor
for the haematocrit was calculated by dividing the baseline
haematocrit by the haematocrit values measured at the sampling
time points during ECC.
10
Values were multiplied by this factor
to adjust for haemodilution.
Results
To examine the effect of LA on synthesis of IL-6, IL-8, C3, C4,
ASO, CRP and haptoglobulin, LA was introduced into the ECC
and blood samples were drawn before and after CPB at different
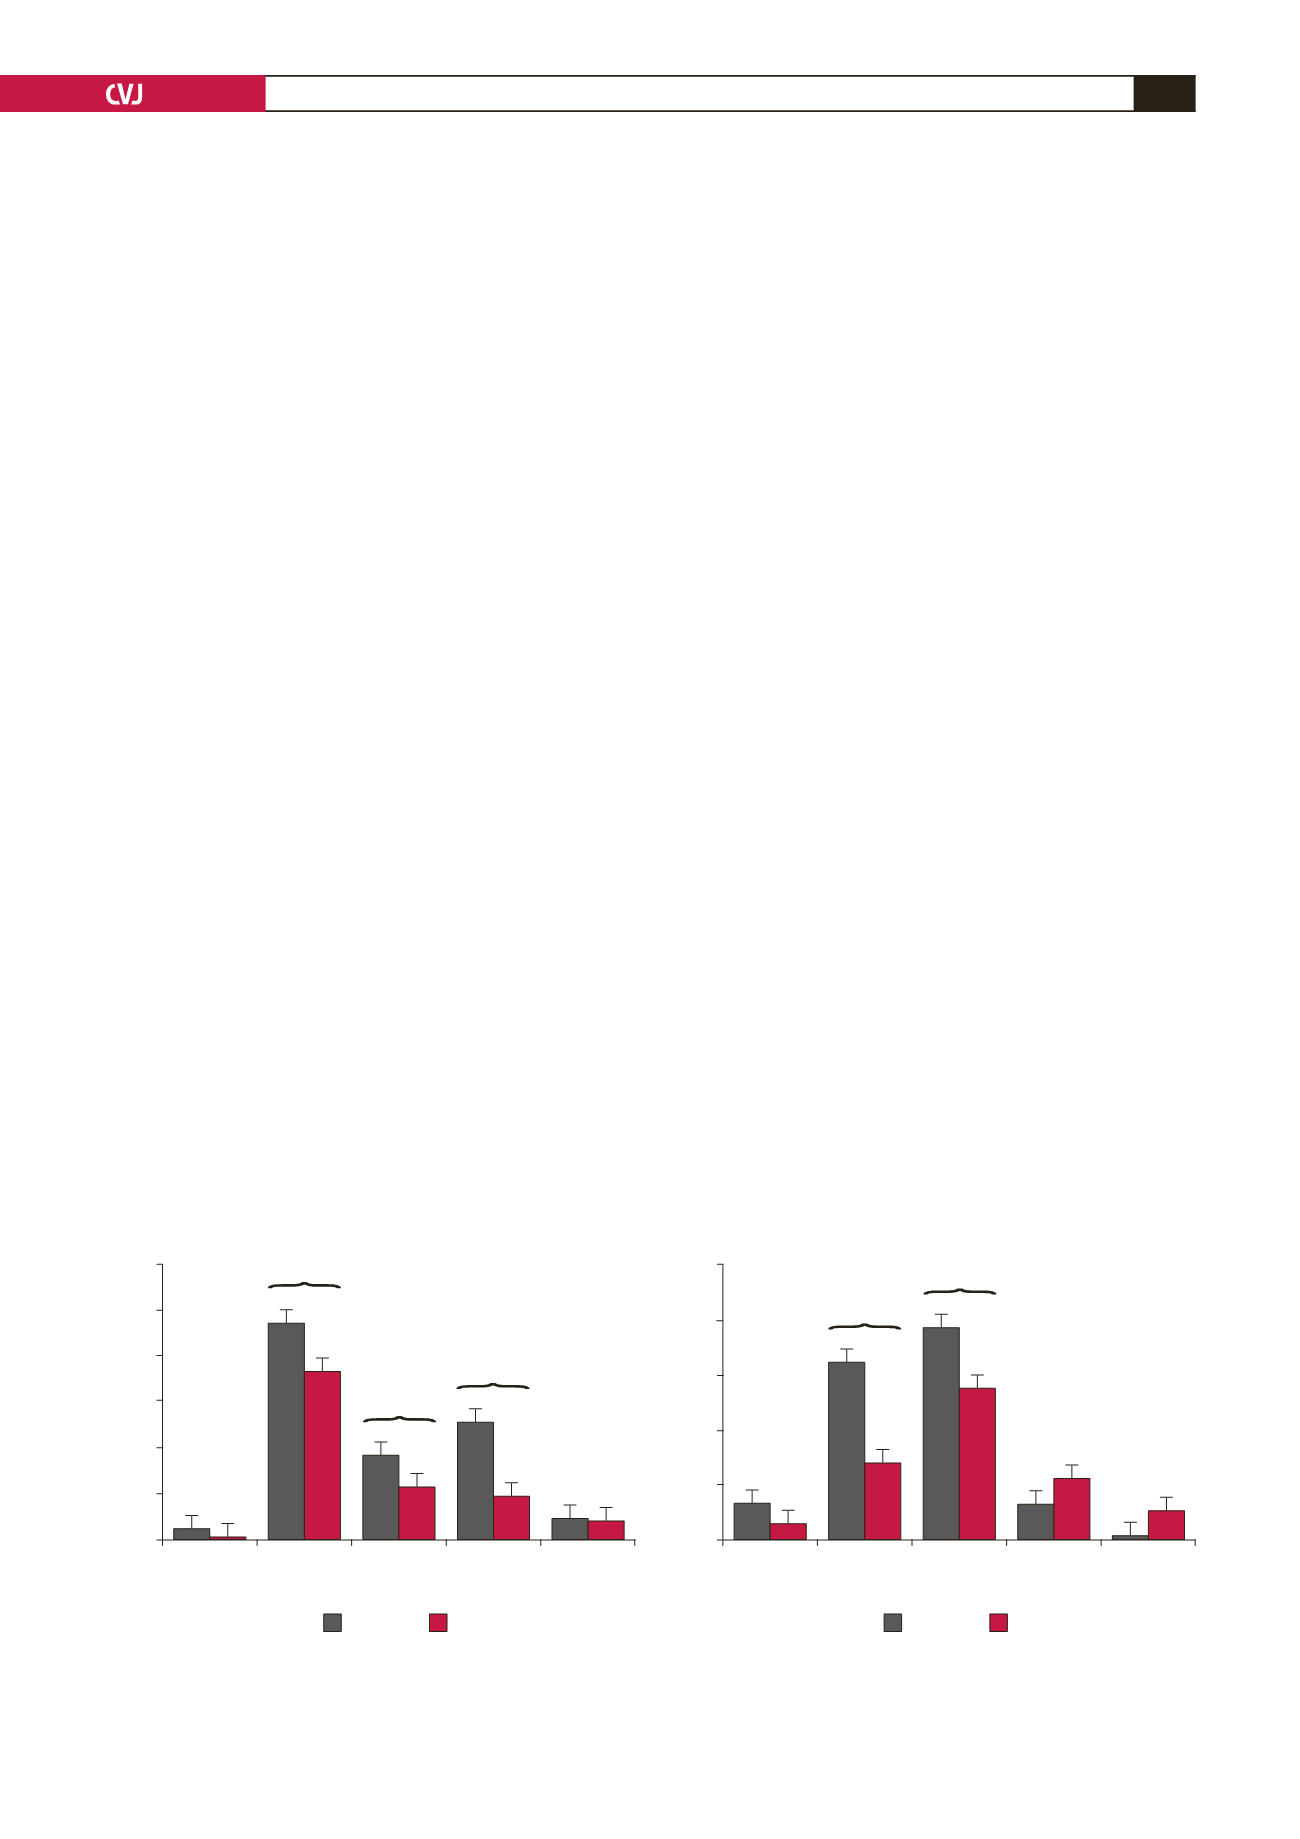
time periods (Figs 1–5). As shown in Fig. 1A, IL-6 levels initially
increased and then decreased after LA administration. There
was a detectable cytokine release after one hour of surgery, with
the maximum effect obtained after one hour of ECC (
p
<
0.05).
Thereafter IL-6 levels decreased in a time-dependent manner,
compared with the controls and samples taken before surgery.
Therefore, treatment with LA caused reduced IL-6 levels,
compared with controls.
Similarly, LA decreased IL-8 levels significantly (
p
<
0.05),
compared with the controls (Fig. 1B). IL-8 levels were highest
in the P3 period.
C3 levels were high pre-operatively. LA administration
decreased C3 levels in the post-operative period compared to P1
(Fig. 2A). The effect of LA was clearly seen in C4 levels (Fig.
2B), which were lower in P2, P3, P4, P5 samples than in P1 (
p
<
0.05).
CRP levels did not show any significant change in the first
three time periods (Fig. 3). Interleukin release was associated
with CRP levels. After interleukins were released, CRP was
synthesised and increased significantly in the P4 and P5 periods
(
p
<
0.05).
Fig. 1. ECC with LA administration had a significant effect on Il-6 (A) and Il-8 (B) release. Mean values of all baseline
samples were transformed to 100% and data measured during ECC are given in relation to the adjusted baseline value
in each treatment group. *
p
<
0.05 indicates statistical significance versus the respective baseline value in each group.
#
p
<
0.05 indicates statistical significance between the two groups at each time point.
100
80
60
40
20
0
P1
P2
P3
P4
P5
Time periods
IL-8 (pg/ml)
Control
LA
*
*
*
*
#
#
B
120
100
80
60
40
20
0
P1
P2
P3
P4
P5
Time periods
IL-6 (pg/ml)
Control
LA
*
*
*
*
*
*
#
#
#
A


