
CARDIOVASCULAR JOURNAL OF AFRICA • Volume 25, No 6, November/December 2014
e2
AFRICA
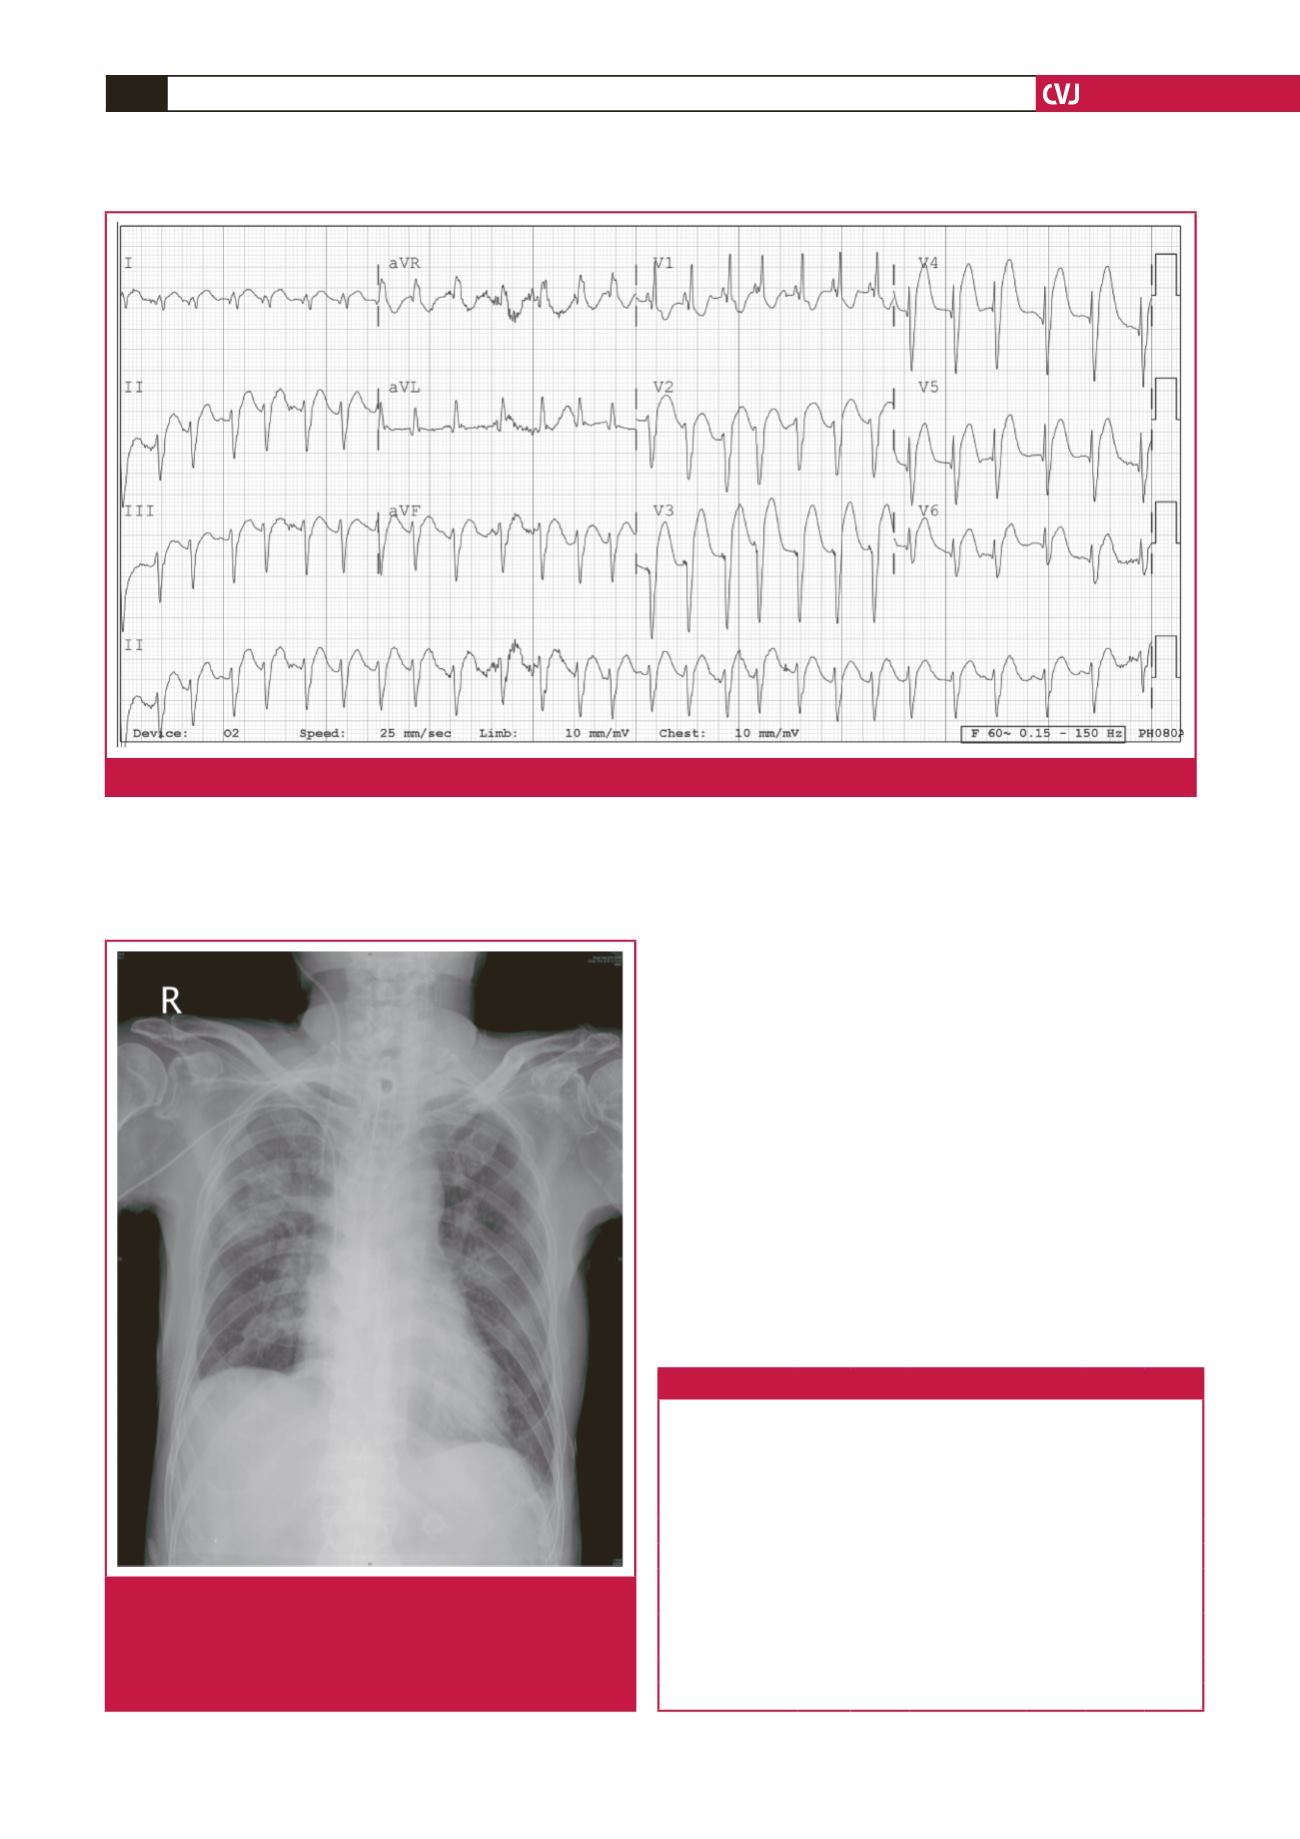
coronary event, supported by chest pain, sudden onset of
hypotension, diffuse ST-segment elevation on ECG, and previous
history of coronary disease. Emergency coronary angiography
(CAG) was done. It showed 75% focal stenosis on the circumflex
artery os and 75% diffuse stenosis on the obtuse marginal
branch, but there was no significant interval change compared
with the previous CAG (Fig. 3). There was no pulmonary
embolism or deep-vein thrombosis on thromboembolism
computed tomography.
Due to severe respiratory distress, a mechanical ventilator
was applied. The patient developed rapid haemodynamic
deterioration, refractory to vasopressor. Dopamine was increased
up to 20 mcg/kg/min and norepinephrine up to 300 mcg/min.
The pulse was not palpable and his blood pressure was measured
at 67/41 mmHg on arterial line monitoring (Fig. 4).
Acidosis progressively deteriorated despite repetitive
administration of sodium bicarbonate (Table 1). Based on the
patient’s history of TPN use for several months in conjunction
with severe lactic acidosis and left ventricular (LV) dysfunction
on portable echocardiography, cardiac beriberi was highly
suspected. Thiamine 100 mg was immediately administered
intravenously, resulting in a dramatic improvement of his
haemodynamic status. We discovered later that the TPN given
Fig. 1.
Electrocardiogram showing diffuse ST-segment elevation involving nine leads, except aVR, aVL and V1.
Fig. 2.
Chest X-ray showing cardiomegaly with mild pulmo-
nary congestion and pleural effusion from both lungs.
However, consolidation on the right upper lung field
shows no interval change compared with the previous
X-ray.
Table 1. The serial arterial blood gas analysis
Thiamine administration (at 01:30)
↓
Time
16:31 22:02 00:53 02:04 04:10 08:24 13:25
pH
7.49 7.192 7.175 7.136 7.069 7.284 7.439
PCO
2
(mmHg)
22.7 27.5 21.8 30.1 38.4 37.0 30.0
PO
2
(mmHg)
98.8 150.1 162.9 135.1 81.7 83.4 90.3
FiO
2
(%)
35 30 30 30 30 30
Bicarbonate
(mmol/l)
16.8 10.3 7.9 9.9 10.9 17.2 19.9
Base excess
(mmol/l)
–4.9 –16.4 –18.9 –17.8 –18.3 –8.8 –3.5
O
2
saturation (%) 97.8 98.0 98.1 97.4 88.9 94.3 96.3
Lactate (mmol/l)
12.2
15.4


