


 41 / 68

CARDIOVASCULAR JOURNAL OF AFRICA • Volume 26, No 1, January/February 2015
AFRICA
39
Volunteers were invited, and after informed consent, we
conducted an interview, clinical examination and biochemical
investigations for the ascertainment of eligibility. Collections
of venous blood in eligible participants were all done the same
day from an antecubital vein in four EDTA tubes stored in
refrigerated containers for all three assays.
The blood samples collected on the same day for each
participant were immediately transported by car to the target
settings in a refrigerated container. The room temperature
was standardised for all study sites at 25°C, and humidity was
maintained between 45 and 60%.
HbA
1c
measurements were performed using the In2it POC
device (Bio-Rad laboratories, Deeside, UK), which was calibrated
prior to the study, with all reagents from the same lot (072T128).
The same operator performed the assays in each of the settings
within 48 hours of blood collection. All manipulations were
done following the operating procedure of the manufacturer in
order to reduce the variability of the measurements.
Statistical analysis
Using SPSS 17.0, data were analysed and expressed as mean
±
standard deviation. Comparisons across the groups were
done using analysis of variance, and associations were verified
by Spearman’s correlation. Agreement between methods was
assessed using Bland and Altman plots of the difference against
the means of the two methods.
Results
Participants were 12 males and 12 females, aged 54
±
15 years.
Their mean body mass index was 28.9
±
5.8 kg/m
2
, mean systolic
and diastolic blood pressures were 128
±
18 and 77
±
8 mmHg,
respectively, and mean haemoglobin was 13.4
±
1.8 g/dl. The
duration of diabetes in all patients was 10
±
6 years with a
pre-inclusion HbA
1c
value of 7.8
±
2.3%.
Overall, there was no statistically significant difference
between mean HbA
1c
measurements across the sites (Table 1).
The correlation between measurements varied from
r
=
0.89,
p
<
0.001 between the 650-m/1 600-m altitudes,
r
=
0.92,
p
<
0.001
between the 13-m/650-m altitudes, to
r
=
0.96,
p
<
0.001 between
13-m/1 600-m altitudes. The coefficient of variation (CV) was
3.4% for the 650-m/13-m duplicates, 5.1% for 1 600-m/13-m
duplicates and 3.2% for 1 600-m/650-m duplicates.
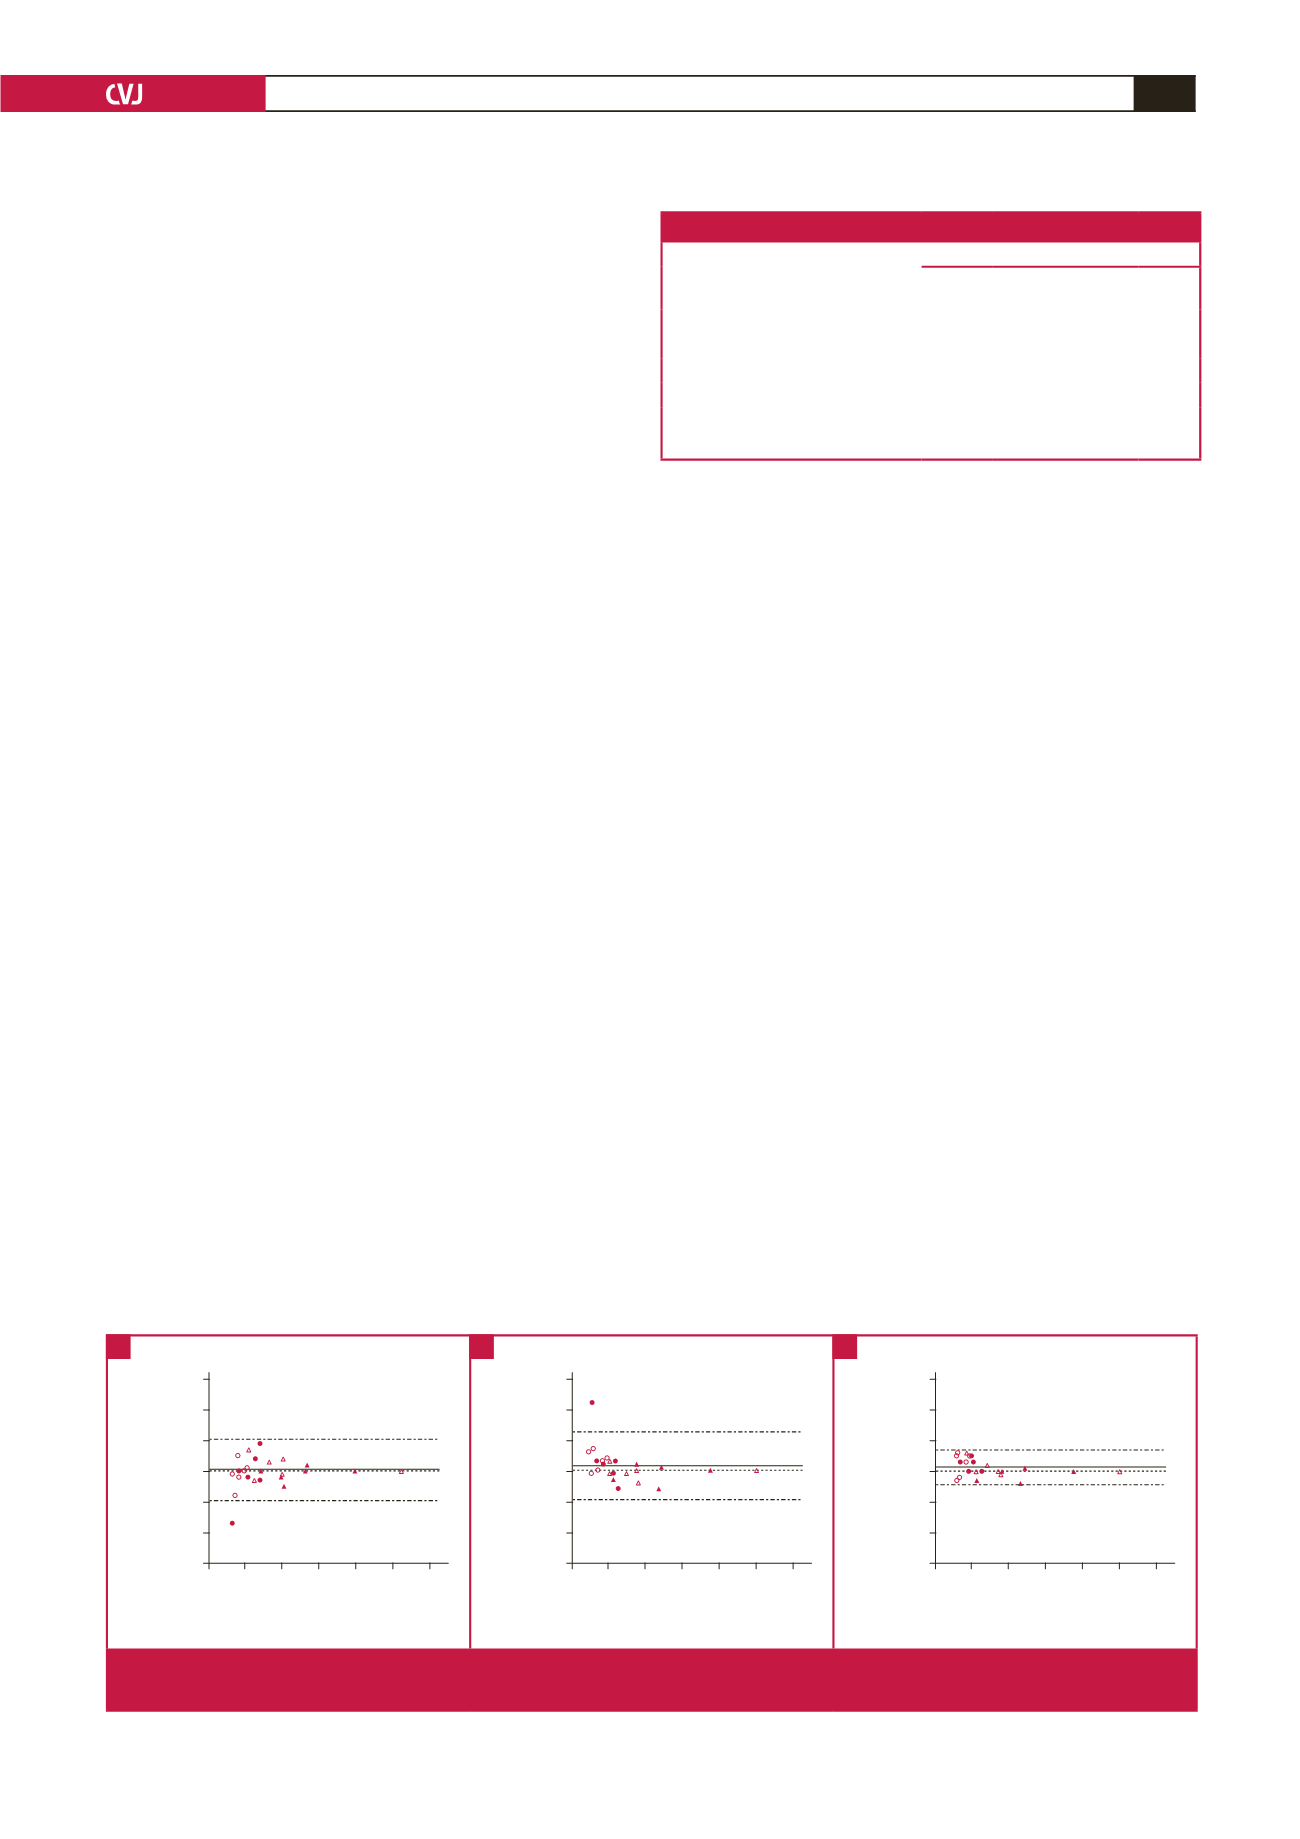
The mean differences expressed as estimates (95% CI)
in percentages between measurements at two different sites
were –0.04 (–1.05−0.97%),
+
0.14 (0.95−1.24%) and
+
0.13
(–0.45−0.70%), respectively, between the 650-m/13-m (Fig. 1A),
1 600-m/650-m (Fig. 1B), and 1 600-m/13-m altitudes (Fig. 1C).
The HbA
1c
differences were
>
0.5% (8 mmol/mol) in 3/24
(12%) between the 1 600-m/13-m measurements, 4/24 (17%)
between the 650-m/13-m measurements and in 6/24 (25%)
between the 1 600-m/650-m measurements. In only one case
associated with more than one percentage difference across sites
was a patient with one of the readings at 4.2% (22 mmol/mol) in
one site, which normally would have prompted a second check.
We did not find any differences in the percentage variation of
HbA
1c
levels at the low (
n
=
12), medium (
n
=
6) and high (
n
=
6) values for the different study sites, namely 650-m/13-m (
p
=
0.453), 1 600-m/650-m (
p
=
0.111) and 1 600-m/13-m altitudes
(
p
=
0.344).
Discussion
This study indicates that the POC analyser showed no significant
differences across Cameroonian sites located at altitudes varying
from 13 to 1 600 m (
≤
0.5% in 75% of comparisons). Although
measurements were not repeated in each site to reflect clinical
practice, our results suggest a test reliability of the In2it POC
instrument below 1 600 m.
Interestingly, previous studies in which the device calibration
was performed with HPLC, had suggested satisfactory external
validity.
7
This was however not investigated in our study and
therefore represents a major limitation with the sample size.
However, considering our findings and the cut-off value
of 3.5% of CV for optimal performance between laboratories
(between study sites in our case), one could say that although
Table 1. Comparison of mean HbA
1c
levels by group across the sites
Point-of-care In2it analyser
Study group
Douala
(13 m)
Yaounde
(650 m)
Bamenda
(1 600 m)
p
-value
Healthy controls
5.0
±
0.6 5.4
±
0.3 5.6
±
0.5 0.15
Patients with diabetes
HbA
1c
<
6.5% (
<
49 mmol/mol)
5.9
±
0.6 5.7
±
0.6 5.9
±
0.4 0.29
HbA
1c
6.5–8.0% (49–64 mmol/mol) 8.1
±
3.0 7.9
±
3.1 8.0
±
3.0 0.66
HbA
1c
>
8.0% (
>
64 mmol/mol)
8.4
±
1.8 8.5
±
1.7 9.0
±
2.2 0.84
All study participants
6.8
±
2.2 6.9
±
2.2 7.1
±
2.3 0.31
3
2
1
0
–1
–2
–3
4 6 8 10 12 14 16
Average of POC HbA
1c
at 650 and 13 m (%)
Difference POC HbA
1c
at 650 and 13 m (%)
+1.96 SD: 0.97
Mean: –0.04
–1.96 SD: –1.05
3
2
1
0
–1
–2
–3
4 6 8 10 12 14 16
Average of POC HbA
1c
at 1600 and 650 m (%)
Difference POC HbA
1c
at 1600 and 650 m (%)
+1.96 SD: 1.24
Mean: 0.14
–1.96 SD: –0.95
3
2
1
0
–1
–2
–3
4 6 8 10 12 14 16
Average of POC HbA
1c
at 1600 and 13 m (%)
Difference POC HbA
1c
at 1600 and 13 m (%)
+1.96 SD: 0.70
Mean: 0.13
–1.96 SD: –0.45
Fig. 1.
Plots of the differences against averages of POC HbA
1c
levels at 13-m and 650-m altitudes (A), 1 600-m and 650-m altitudes
(B), and a1 600-m and 13-m altitudes (C), with mean difference (bias) and 95% agreement limits.
A
B
C