
CARDIOVASCULAR JOURNAL OF AFRICA • Volume 26, No 6, November/December 2015
AFRICA
245
lungs, kidneys or adrenal glands. However, co-treatment with
ISO and Mg
2+
significantly decreased the kidney weight:body
weight ratio compared to the controls (
p
<
0.01). When Mg
2+
was administered alone, it did not significantly affect the body
weight or the weights of any of the organs compared with the
control rats.
Effects of Mg
2+
on ISO-induced ECG changes
Representative traces of lead II ECG waveforms recorded from
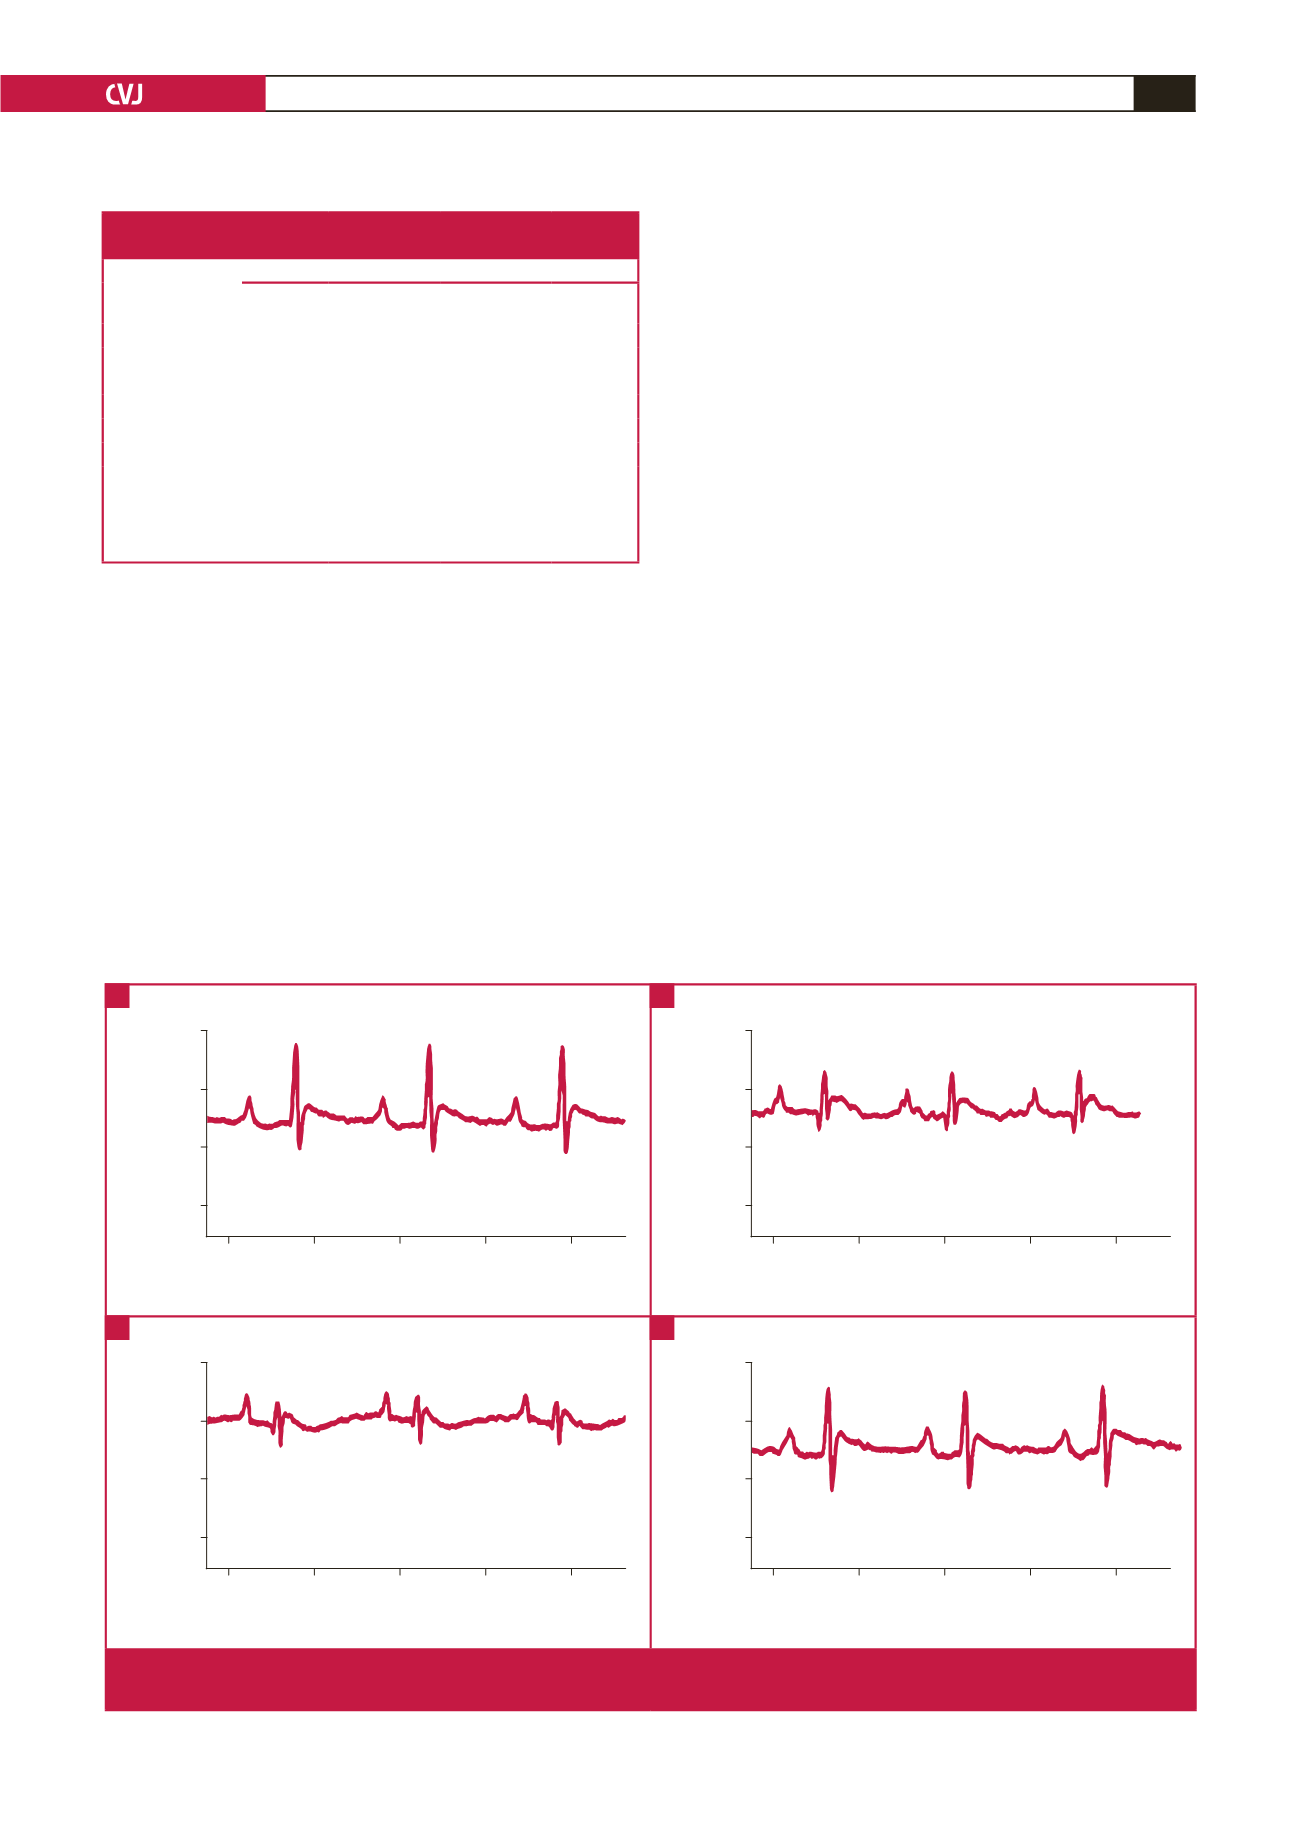
individual rats are shown in Fig. 2. Qualitatively, ISO produced
a low-voltage ECG recording, with qualitatively large Q waves
compared with the controls (Fig. 2A, B). The changes in ECG
characteristics produced by various treatments are summarised
in Table 2. ISO did not significantly alter the heart rate, the
P-wave amplitude and duration, the S-wave amplitude, or the
ST-segment height. The drug also had no effects on the PR
interval, QRS duration, QT interval or QTc interval.
ISO, however, decreased the R-wave amplitude compared
with the controls (
p
<
0.001), an effect consistent with the
low-voltage ECG waveform illustrated in Fig. 2B. ISO also
produced prominent Q waves compared with the controls (
p
<
0.01), suggesting the presence of an evolving infarct.
38
The drug
also altered ventricular repolarisation by significantly decreasing
both the T-wave amplitude and the T
peak
–T
end
interval compared
with the controls (
p
<
0.05 in each case).
Pre-treatment with Mg
2+
did not affect the ISO-induced
changes in ECG voltage or the heart rate, P-wave amplitude and
duration, PR interval, QRS duration, QT interval, QTc interval,
or the ST-segment height. However, Mg
2+
decreased the S-wave
amplitude (
p
<
0.05), and further decreased the T-wave amplitude
(
p
<
0.001) in ISO‑treated hearts compared with the controls,
but without causing further changes to the T
peak
–T
end
interval.
Although not statistically significant, as illustrated in Fig. 2C,
Mg
2+
also tended to reduce the size of the Q waves induced by
ISO. Mg
2+
alone did not affect the ECG characteristics compared
with those in control rats.
Effects on haemodynamic parameters
The effects of chemical treatments on haemodynamic
parameters are shown in Fig. 3. ISO significantly decreased
Table 1. Effects of chemical treatments on body weight (BW)
and on the weights of various organs
Weight parameter
Treatment groups
Control
(
n
=
8)
ISO
(
n
=
9)
ISO + Mg
2+
(
n
=
10)
Mg
2+
(
n
=
8)
% BW lost
0.54
±
0.16 –3.65
±
0.61* –3.77
±
1.31* –0.74
±
0.79
Heart:BW (mg/g)
3.33
±
0.06 4.82
±
0.06*** 4.74
±
0.13*** 3.34
±
0.05
Liver:BW (mg/g)
50.68
±
1.11 47.34
±
2.34 44.08
±
1.32 50.54
±
1.87
Lung:BW (mg/g)
3.62
±
0.20 3.21
±
0.10
3.35
±
0.10
3.46
±
0.20
Kidney:BW (mg/g) 6.86
±
0.10 6.58
±
0.10
6.38
±
0.10** 6.57
±
0.10
Adrenal:BW (mg/g) 0.20
±
0.01 0.24
±
0.01
0.23
±
0.01
0.22
±
0.01
Body weight: BW. The percentage (%) BW lost was calculated from the differ-
ences between the BW measured on the day of treatment and 24 hours later. The
organ:BW ratios (mg/g) were based on the BW measured 24 hours post-treatment
at organ extraction. Values are mean
±
SEM; *
p
<
0.05; **
p
<
0.01 and ***
p
<
0.001 (treatment vs control).
Voltage (mV)
0.0
0.1
0.2
0.3
0.4
Time (s)
0.0
–0.5
–1.0
–1.5
Control
Voltage (mV)
0.0
0.1
0.2
0.3
0.4
Time (s)
0.0
–0.5
–1.0
–1.5
ISO
Voltage (mV)
0.0
0.1
0.2
0.3
0.4
Time (s)
0.0
–0.5
–1.0
–1.5
ISO + Mg
Voltage (mV)
0.0
0.1
0.2
0.3
0.4
Time (s)
0.0
–0.5
–1.0
–1.5
Mg
Fig. 2.
Effects of various treatments on the ECG waveforms. Segments of original lead II ECG traces recorded from individual rats
under various treatments, A: saline (control), B: ISO, C: ISO + Mg
2+
, and D: Mg
2+
.
A
C
B
D


