
CARDIOVASCULAR JOURNAL OF AFRICA • Volume 27, No 5, September/October 2016
302
AFRICA
and
p
=
0.033, respectively) (Fig. 2B). There were no statistically
significant differences between the levels of TNF-
α
in the
pericardial fluid in the group with no previous MI, the anterior
MI and the posterior/inferior MI groups (13.08
±
8.66, 19.01
±
10.37 and 14.99
±
6.85 pg/ml,
p
=
0.203) (Fig. 2B). The level of
angiotensin-II in the pericardial fluid in the anterior MI group
was significantly higher than that in the group with no previous
MI (21.83
±
14.48 vs 14.60
±
5.25 pmol/l,
p
=
0.019) (Fig. 2B).
The results of LVEDD, LVEDV and LVEDVI in the three
groups are shown in Fig. 3A. The results of LVESD, LVESV and
LVESVI in the groups are shown in Fig. 3B. The results of FS
(%) and EF (%) in the groups are shown in Fig. 3C.
The mean LVEDD in the anterior MI group was significantly
higher than that in the group with no previous MI (53.39
±
4.43 vs 49.05
±
3.79 mm, p
=
0.004) (Fig. 3A). There were no
statistically significant differences between the mean LVEDV
in the group with no previous MI, the anterior MI and the
posterior/inferior MI groups (113.97
±
31.13, 127.14
±
39.19 and
118.20
±
33.55 ml, respectively,
p
=
0.474) (Fig. 3A). There were
no statistically significant differences between the mean LVEDVI
in the group with no previous MI, the anterior MI and the
posterior/inferior MI groups (63.22
±
18.58, 73.03
±
24.34 and
65.57
±
18.54 ml/m
2
,
p
=
0.366) (Fig. 3A).
The mean LVESD in the anterior MI group (39.23
±
5.46
mm) was significantly higher than that in both the group with
no previous MI (32.10
±
5.25 mm) and the posterior/inferior MI
group (33.75
±
4.54 mm) (
p
=
0.000 and
p
=
0.003, respectively)
(Fig. 3B). The mean LVESV in the anterior MI group (76.29
±
25.95 ml) was significantly higher than that in both the group
with no previous MI (55.24
±
21.76 ml) and the posterior/
Plasma adrenomedullin
Plasma TNF-alpha
Plasma IL-6
No previous MI
Anterior MI
Posterior/inferior
MI
Levels (pg/ml)
12.00
10.00
8.00
6.00
4.00
2.00
0.00
*
Plasma IL-1-beta
Plasma angiotensin
No previous MI
Anterior MI
Posterior/inferior
MI
Levels (pg/ml)
120.00
100.00
80.00
60.00
40.00
20.00
0.00
*
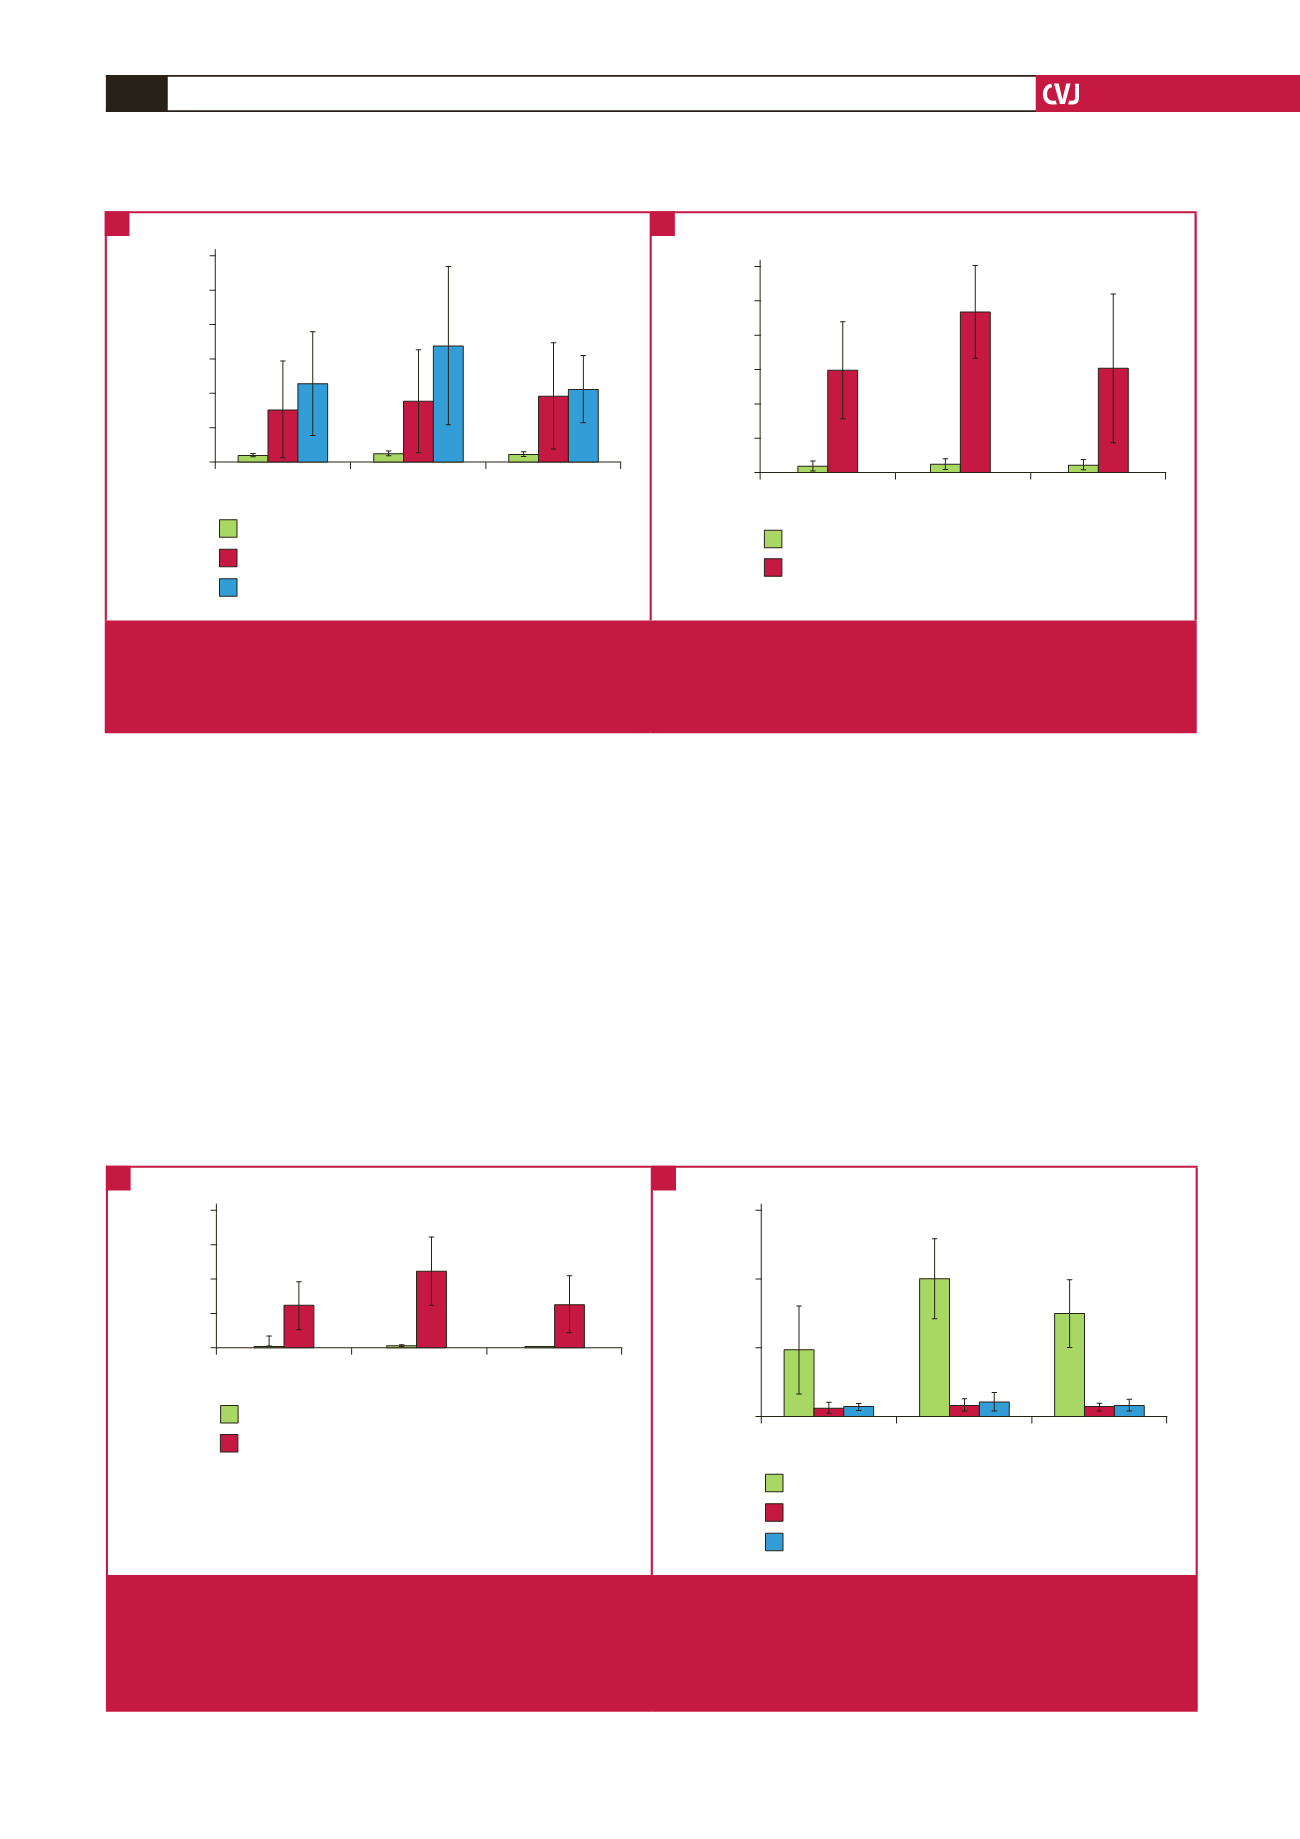
Fig. 1.
A. The levels of adrenomedullin, IL-6 and TNF-alpha in plasma. *
p
<
0.05 for adrenomedullin in the anterior MI group vs in
the other groups. B. The levels of IL-1-beta and angiotensin-II in plasma. *
p
<
0.05 for angiotensin in the anterior MI group
vs in the group with no previous MI. IL-6
=
interleukin-6, TNF-alpha
=
tumour necrosis factor-alpha, IL-1-beta
=
interleukin-
1-beta, Angiotensin
=
angiotensin-II.
A
B
Pericardial adrenomedullin
Pericardial IL-1-beta
No previous MI
Anterior MI
Posterior/inferior
MI
Levels (pg/ml)
20.00
15.00
10.00
5.00
0.00
*
*
Pericardial IL-6
Pericardial angiotensin
Pericardial TNF-alpha
No previous MI
Anterior MI
Posterior/inferior
MI
Levels (pg/ml)
300.00
200.00
100.00
0.00
*
*
Fig. 2.
A. The levels of adrenomedullin and IL-1-beta in pericardial fluid. *
p
<
0.05 for adrenomedullin in the anterior MI group vs in
the group with no previous MI,
†
p
<
0.05 for IL-1-beta in the anterior MI group vs in the other groups. B. The levels of IL-6,
TNF-alpha and angiotensin-II in pericardial fluid. *
p
<
0.05 for IL-6 in the anterior MI group vs in the other groups,
†
p
<
0.05
for angiotensin-II in the anterior MI group vs in the group with no previous MI. TNF-alpha
=
tumour necrosis factor-alpha,
IL-1-beta
=
interleukin-1-beta, Angiotensin
=
angiotensin-II.
A
B


