


 38 / 70

CARDIOVASCULAR JOURNAL OF AFRICA • Volume 27, No 5, September/October 2016
308
AFRICA
Methods
In this study, 21 patients with Wilson’s disease who applied to
our hospital’s Paediatric Gastroenterology Department between
May and October 2013 were included (
α
=
0.05, 1–
β
=
0.8,
changing ratio
=
0.0015). The control group consisted of 20 age-
and gender-matched healthy children. Patients with any chronic
disease, obesity and hypertension in addition to Wilson’s disease
or history of drug use that may have affected cardiac function
were excluded from the study.
Diagnosis of Wilson’s disease was made by the Paediatric
Gastroenterology Department, based on the presence of signs
of liver or neurological disease and the detection of Kayser–
Fleischer rings, low ceruloplasmin, and elevated levels of urinary
and hepatic copper. Liver biopsies were done for all patients and
associated histological changes in the liver were confirmed.
Before the study, approval of the ethics committee of
the Medical School of Inonu University in accordance with
Declaration of Helsinki was received.
Age, body weight, height and body surface area were recorded
in the patient and control groups. The age at diagnosis of
Wilson’s disease was also recorded in the patient group. All
subjects were evaluated with ECG before echocardiographic
evaluation.
All patients and controls were evaluated with two-dimension-
al (2D) and color-coded conventional transthoracic echocar-
diography by the same paediatric cardiologist, using the same
echocardiography machine (Vivid E9, GE Healthcare, Norway)
in the standard precordial positions, according to the American
Society of Echocardiography recommendations.
7
Left ventricu-
lar dimensions, left ventricular wall thickness, end-diastolic and
end-systolic volumes, stroke volume, cardiac index, ejection frac-
tion and fractional shortening were measured using M-mode
echocardiography in the parasternal long-axis view.
2D strain and strain rate echocardiography were performed
by a paediatric cardiologist after the ECG probes of the
echocardiography machine (Vivid E9, GE) were adjusted for
ECG monitoring. Grey images were obtained from the apical
four-, three- and two-chamber, and short-axis view at the
papillary muscle position using tissue harmonic imaging with
frame rates of 70 per second. All the images that were obtained
in the left lateral decubitus position and under ECG monitoring
were stored for offline analysis.
2D strain and strain rate measurements were performed using
the ECHOPAC software package. As previously described, the
endocardial border was traced manually on a single end-diastolic
frame and the software automatically tracked the contour on
subsequent frames. Tracking accuracy was verified in real time
and corrected by adjusting the region of interest or by manually
correcting the contour to ensure optimal tracking. If required,
region-of-interest width or smoothing functions were changed
for optimal tracking. Once the contours were approved by the
paediatric cardiologist, the software calculated longitudinal,
transverse, radial and global strains for the respective segments.
For long-axis strain and strain rate evaluation, the atrioventricular
valve closure time was selected manually.
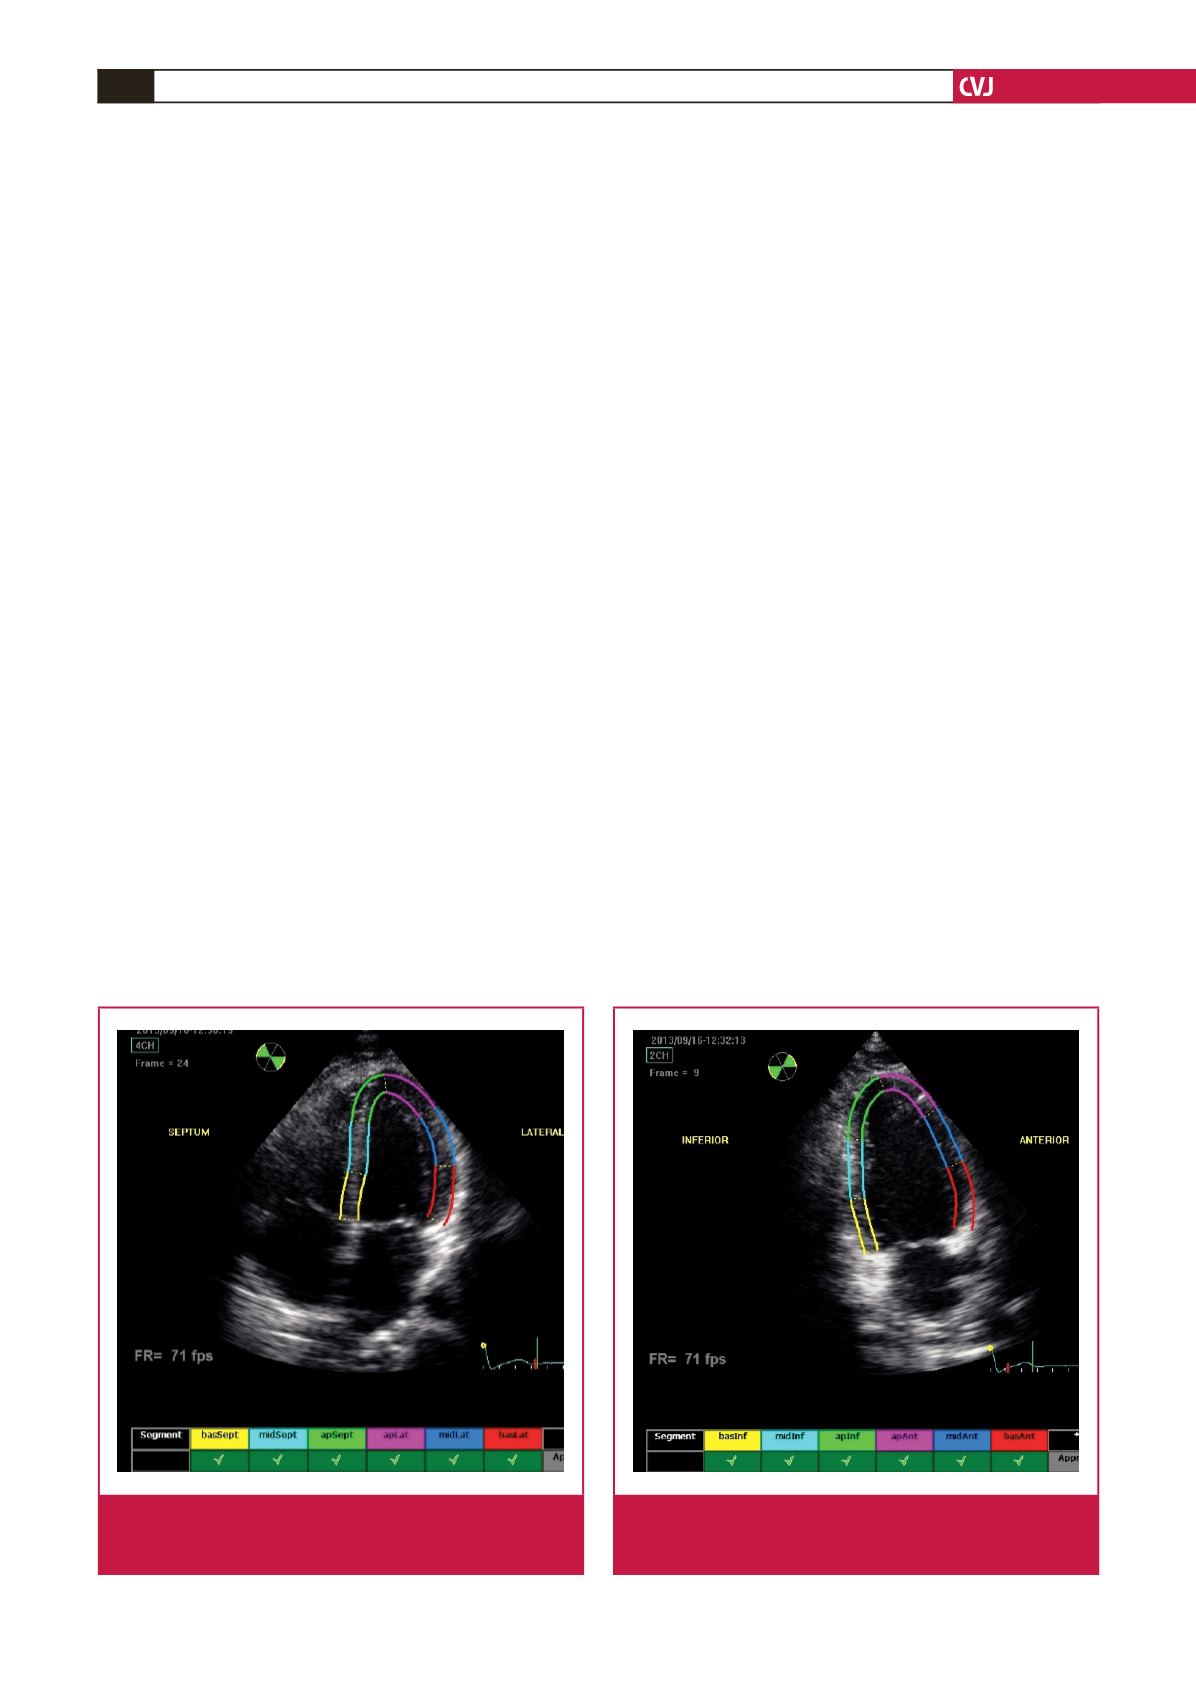
As described, longitudinal and transverse radial strain, and
strain rate were assessed from six basal and six mid-ventricular
segments of the left ventricle, as recommended by the American
Society of Echocardiography (Figs 1–4). This included apical,
mid- and basal segments from the four-, two- and three-chamber
view of the left ventricle, and anterior, septal and inferior
segments from the short-axis view of the left ventricle.
Statistical analysis
SPSS 16.0 was used for statistical analysis. The normality was
tested using the Kolmogorov–Smirnov test. The unpaired
t
-test
was used to test for differences between categorical data of
Fig. 1.
Echocardiograph shows segmental analysis of left
ventricle after 2D speckle tracking from the apical four-
chamber view.
Fig. 2.
Echocardiograph shows segmental analysis of left
ventricle after 2D speckle tracking from the apical
two-chamber view.