


 33 / 70

CARDIOVASCULAR JOURNAL OF AFRICA • Volume 27, No 5, September/October 2016
AFRICA
303
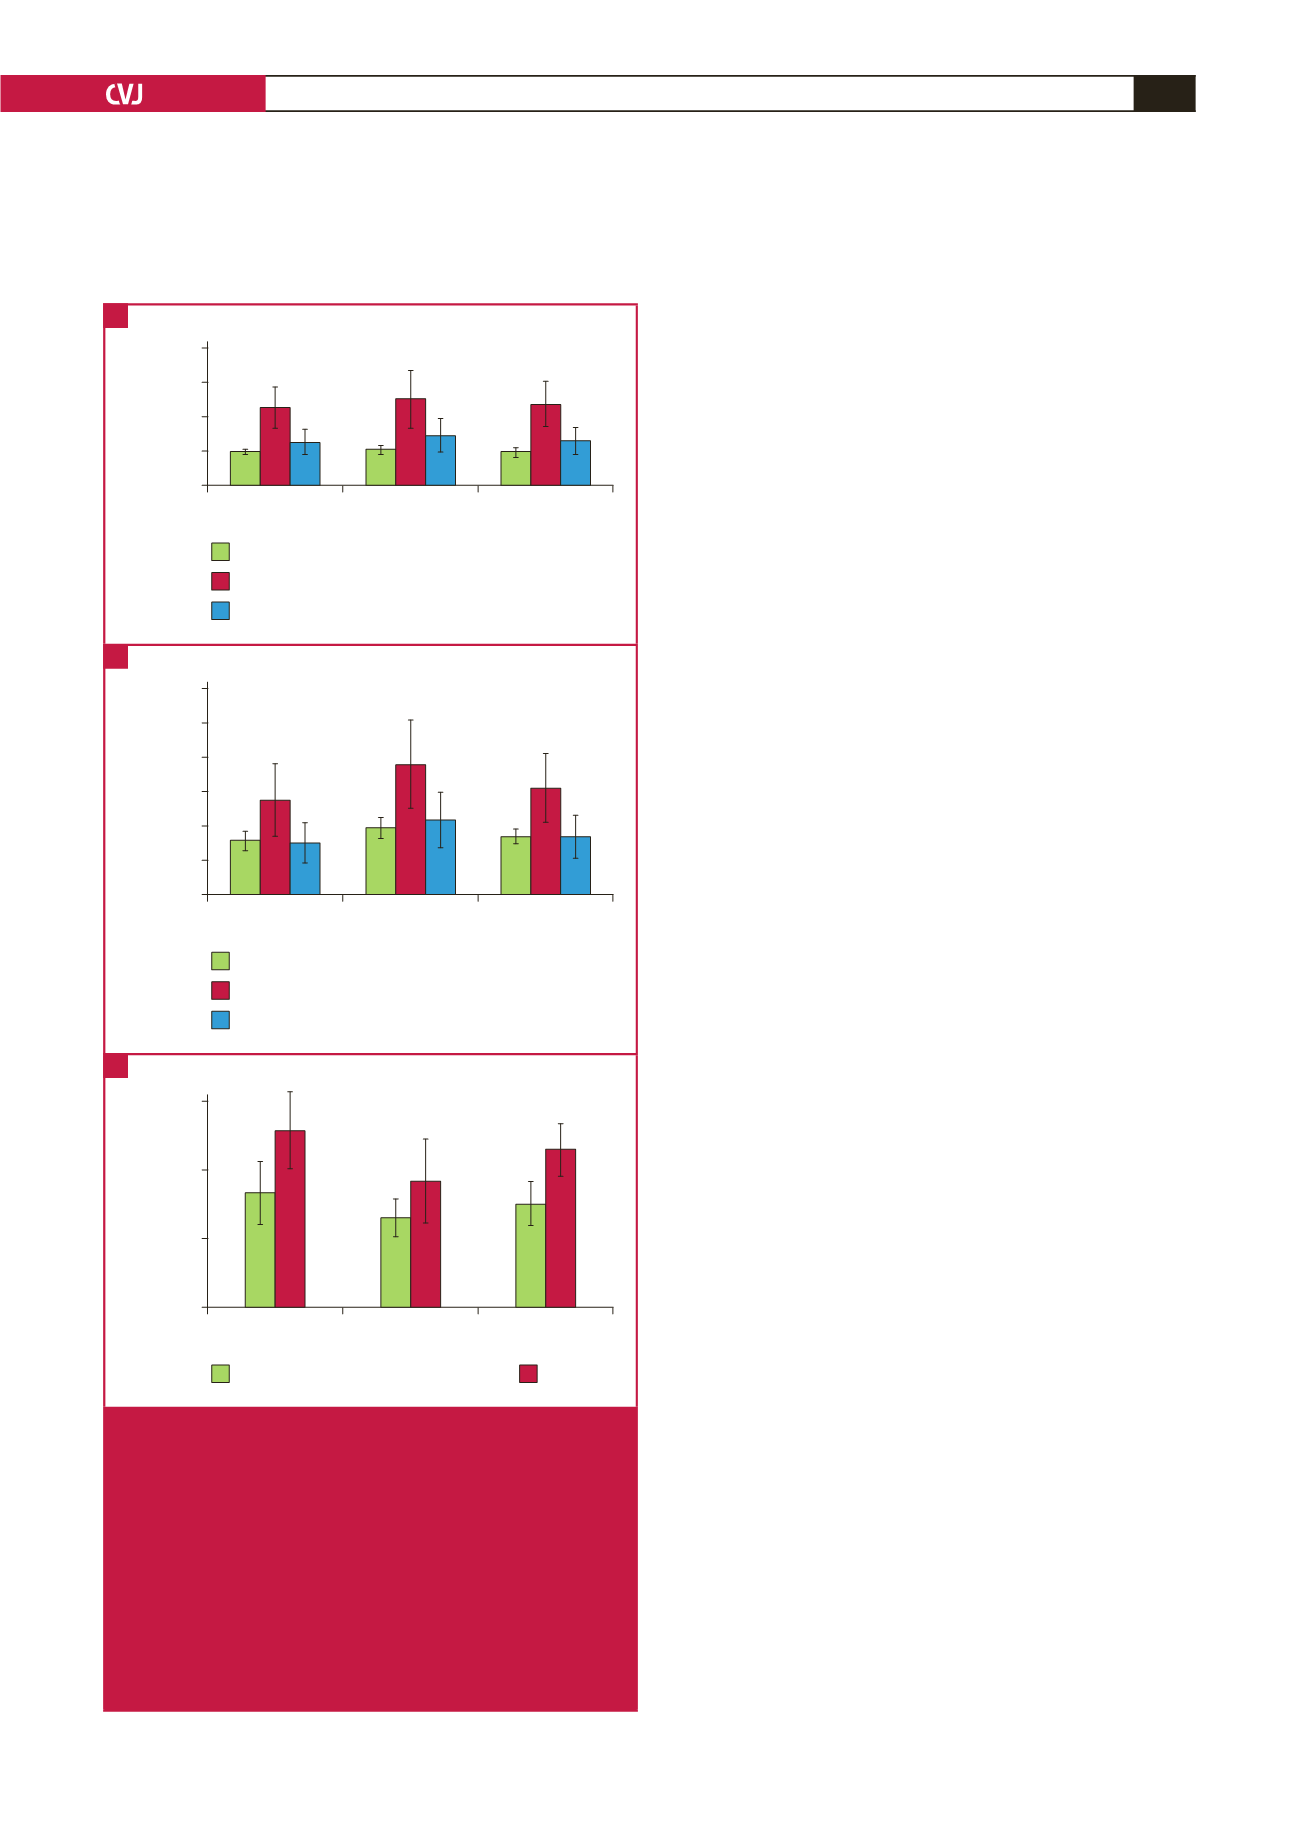
inferior MI group (62.35
±
19.86 ml) (
p
=
0.002 and
p
=
0.028,
respectively) (Fig. 3B). The mean LVESVI in the anterior MI
group (43.74
±
16.11 ml/m
2
) was significantly higher than that in
both the group with no previous MI (30.52
±
12.02 ml/m
2
) and
the posterior/inferior MI group (34.67
±
11.76 ml/m
2
) (
p
=
0.002
and
p
=
0.026, respectively) (Fig. 3B).
The mean LVEF in the anterior MI group (36.90
±
12.21%)
was significantly lower than that in both the group with no
previous MI (51.62
±
10.97%) and the posterior/inferior MI
group (46.00
±
7.54%) (
p
=
0.002 and
p
=
0.024, respectively)
(Fig. 3C). The differences in FS values between the groups were
similar to the differences in EF values (Fig. 3C).
Discussion
The results of this study indicate that (1) the patients who had
suffered an anterior MI had worse LV function than both those
with no previous MI and those with posterior/inferior MI, and
(2) the levels of pro-inflammatory cytokines in the plasma and
pericardial fluid in patients with anterior MI were increased
compared to patients with no previous MI.
Adrenomedullin, a 52-amino acid peptide with structural
homology to calcitonin gene-related peptide, was initially
isolated from human phaeochromocytoma.
11
Adrenomedullin
is synthesised by many mammalian tissues, including the
adrenal medulla, endothelial and vascular smooth muscle cells,
myocardium and central nervous system.
12
Clinical studies suggest that synthesis of adrenomedullin is
up-regulated during myocardial ischaemia. Measurement of
plasma levels of adrenomedullin in patients in the acute stages
of MI showed elevated circulating levels of adrenomedullin
within 24 to 48 hours of admission, which gradually decreased
over a three-week period.
13
On the other hand, Miyao
et al
.
14
reported that in patients with acute MI, increased plasma levels
of adrenomedullin in the very early phase of acute MI returned
to normal limits approximately four weeks later.
In our study, the timespan between MI and CABG was three
weeks or longer. We found that plasma adrenomedullin levels in
both the anterior MI and the posterior/inferior MI groups were
higher than that in the group with no previous MI. In agreement
with the results of Miyao
et al
.,
14
our results suggest that the
elevated adrenomedullin levels were most likely a consequence
of the recent MI.
It is generally considered that pericardial fluid is not merely
an ultra-filtrate of plasma, but also a transudate from the
cardiac interstitium.
15
Adrenomedullin mRNA is expressed by
several cardiovascular tissues, including the cardiomyocytes,
vascular endothelial and smooth muscle cells.
12
Therefore, it can
be assumed that the level of adrenomedullin in pericardial fluid
may increase concomitantly with plasma levels.
Supporting this assumption, increased pericardial fluid
concentrations of adrenomedullin have been reported in patients
with cardiac remodelling.
16
Additionally, adrenomedullin levels
were reported to be slightly higher in the pericardial fluid than
in the plasma in patients undergoing CABG.
17
Consistent with
this report, we also found that adrenomedullin levels in the
pericardial fluid were slightly higher than those in the plasma in
all three groups.
In our study, the anterior MI group had the worst LV function,
as shown by echocardiography. Miyao
et al
. suggested that
adrenomedullin levels in patients with acute MI may indirectly
reflect the extent of ventricular dysfunction.
14
In addition,
LVEDD (mm)
LVEDVI (ml/m
2
)
LVEDV (ml)
No previous MI
Anterior MI
Posterior/inferior
MI
200.00
150.00
100.00
50.00
0.00
*
LVESD (mm)
LVESVI (ml/m
2
)
LVESV (ml)
No previous MI
Anterior MI
Posterior/inferior
MI
120.00
100.00
80.00
60.00
40.00
20.00
0.00
*
*
*
FS (%)
LVEF (%)
No previous MI
Anterior MI
Posterior/inferior
MI
60.00
40.00
20.00
0.00
*
*
Fig. 3.
Results of echocardiographic analyses. A. *
p
<
0.05 for
LVEDD in the anterior MI group vs in the group with
no previous MI. B. *
p
<
0.05 for LVESD, LVESV and
LVESVI in the anterior MI group vs in the other groups.
C. *
p
<
0.05 for FS and LVEF in the anterior MI group
vs in the other groups. LVEDD = left ventricular end-
diastolic diameter, LVEDV = left ventricular end-diastolic
volume, LVEDVI = left ventricular end-diastolic volume
index, LVESD = left ventricular end-systolic diameter,
LVESV = left ventricular end-systolic volume, LVESVI =
left ventricular end-systolic volume index, FS = fraction-
al shortening, LVEF = left ventricular ejection fraction.
A
B
C