


 39 / 70

CARDIOVASCULAR JOURNAL OF AFRICA • Volume 27, No 5, September/October 2016
AFRICA
309
the patient and control groups. The ANOVA test was used to
evaluate 2D strain and strain rate values of the two groups for
each segment. The LD test was applied in the second test to
determine the groups that differed significantly. All the results
are expressed as mean
±
standard deviation;
p-
values
<
0.05 were
considered statistically significant.
Results
The study included 21 patients with Wilson’s disease and 20
healthy age-matched children. The patient group consisted of
11 males and 10 females, and the control group, nine males and
11 females. Demographic data of the patient and control groups
are shown in Table 1. There were no statistically significant
differences between the patient and control groups (
p
>
0.05).
The mean age at diagnosis was 9
±
2.24 years (5–13) in the
patient group. All the subjects had normal sinus rhythm. Wolf–
Parkinson–White syndrome was detected in one patient’s ECG.
No structural heart disease was detected with conventional 2D
colour-coded transthoracic echocardiography. Left ventricular
wall thickness (IVSd, IVSs, LPWd, LWPDs), systolic and
diastolic diameters (LVIDd, LVIDs), left ventricular diameters
normalised to body surface area (LVEDd/m², LVEDs/m²),
end-systolic and end-diastolic volumes (ESV, EDV), cardiac
output and cardiac index values were within normal limits and
statistically similar in the patient and control groups (
p
>
0.05).
Demographic data, left ventricular wall thickness, dimensions,
volumes and systolic function of the patient and control groups
are shown Table 1.
Global strain and strain rate
No statistically significant differences were found between the
two groups for global longitudinal/circumferential strain rate,
global peak systolic longitudinal/circumferential strain rate,
global peak E longitudinal/circumferential strain rate, peak E
longitudinal velocity of the left basal point, peak E longitudinal
velocity of the right basal point, and peak A longitudinal
velocity of the left basal point (cm/s).
While the control group had statistically significantly
lower global peak A longitudinal/circumferential strain rates,
the patient group had statistically significantly lower peak
Table 1. Demographic data of left ventricular wall thickness, dimension,
volume and systolic function of
Wilson’s disease patients and controls
Parameters
Patients (n
=
21)
mean
±
SD
Controls (n
=
20)
mean
±
SD
p
-value
Age (years)
11.04
±
3 .58 (5–17)
10.53
±
2.8 (6–16)
0.61
Gender (male/female)
11/10
9/11
0.64
Weight (kg)
38.1
±
16.04
(14.5–68)
39.04
±
13.2
(21.4–67)
0.84
Height (cm)
141.5
±
20.2
(100–187)
141.1
±
14.2
(120–168)
0.93
Body surface area (m
3
)
1.21
±
0.33
(0.63–1.91)
1.22
±
0.25
(0.9–1.72)
0.92
Age of diagnosis
9
±
2.24
(5–13)
–
–
IVSd (mm)
7.14
±
1.10
6.45
±
1.39
0.85
IVSs (mm)
10.76
±
1.78
9.7
±
1.65
0.56
LPWDd (mm)
5.42
±
1.16
5.2
±
1.36
0.56
LPWDs (mm)
9.52
±
2.11
8.8
±
1.28
0.1
LVIDd (mm)
41.6
±
6.81
42.1
±
4.52
0.79
LVEDd/m² (mm/m²)
35.5
±
8.45
35.2
±
5.16
0.92
LVEDs (mm)
24.8
±
4.65
26.5
±
6.09
0.32
LVEDs/m² (mm/m²)
21.05
±
5.08
22.19
±
4.68
0.46
EDV (ml)
83.38
±
28.76
79.8
±
20.41
0.65
ESV (ml )
24.28
±
11.89
29.5
±
20.79
0.32
SV (ml)
60.85
±
20.53
55.80
±
13.65
0.36
CI (ml/min)
4.60
±
1.32
3.98
±
0.78
0.077
EF (%)
71.76
±
6.51
69.90
±
5.33
0.32
FS (%)
40.9
±
5.62
39.1
±
4.54
0.26
EDV: end-diastolic volume, ESV: end-systolic volume, SV: stroke volume, CI:
cardiac index, EF: ejection fraction, FS: fractional shortening, CI: cardiac index.
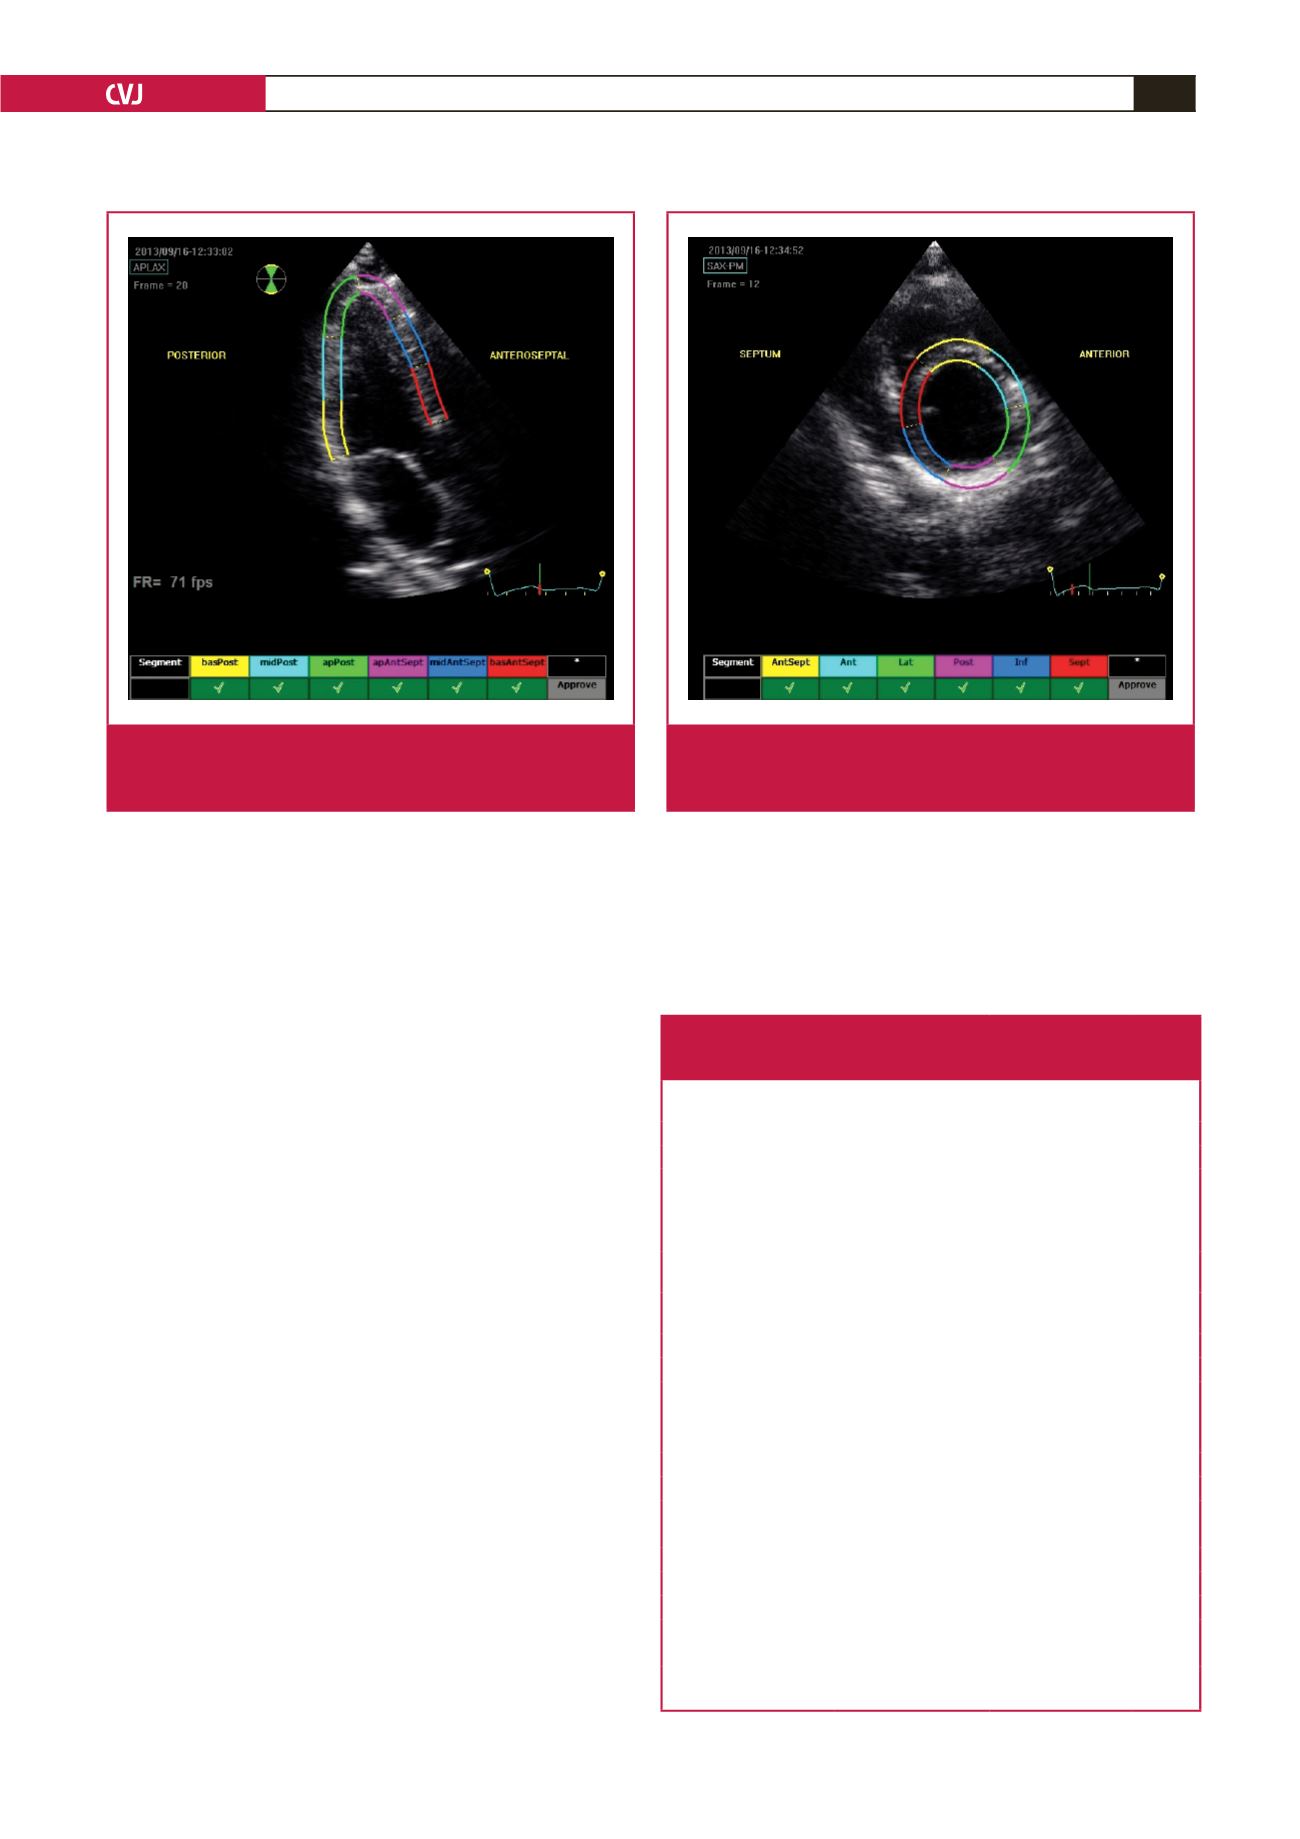
Fig. 3.
Echocardiograph shows segmental analysis of the
left ventricle after 2D speckle tracking from the apical
long-axis view.
Fig. 4.
Echocardiograph shows segmental analysis of the left
ventricle after 2D speckle tracking from the paraster-
nal short-axis view.