
CARDIOVASCULAR JOURNAL OF AFRICA • Volume 28, No 1, January/February 2017
42
AFRICA
levels. The plain sterile tubes for blood and sterile urine cups for
saliva contained 500 kIU aprotonin to preclude proteolysis, and
after clotting, the samples, were immediately centrifuged at 4 000
rpm and kept frozen (−80°C) pending analysis.
All samples were subjected to conventional laboratory analyses
using an autoanalyser, including determination of glucose, total
cholesterol (TC), triglyceride (TG), low-density lipoprotein
cholesterol (LDL-C) and high-density lipoprotein cholesterol
(HDL-C) concentrations. Serum troponin I concentration was
measured by chemiluminescence using a Siemens IMMULITE
2000 XPi immunoassay system (Siemens Healthcare Diagnostics
Inc, Flanders NJ, USA) and commercial kits (Siemens Healthcare
Diagnostics Products Ltd, Llanberis, United Kingdom).
Serum and saliva adropin levels were measured using the
same commercial EIA kits (cat no: EK-032-35) and procedures
(Phoenix Pharmaceuticals, Belmont, CA, USA). The saliva
adropin assay was validated according to previously published
methods.
25
The lowest detectable concentration of adropin was
0.01 ng/ml, with intra- and inter-assay variations of 10 and 15%,
respectively. Absorbance at 450 nm was measured with an ELX
800 ELISA reader.
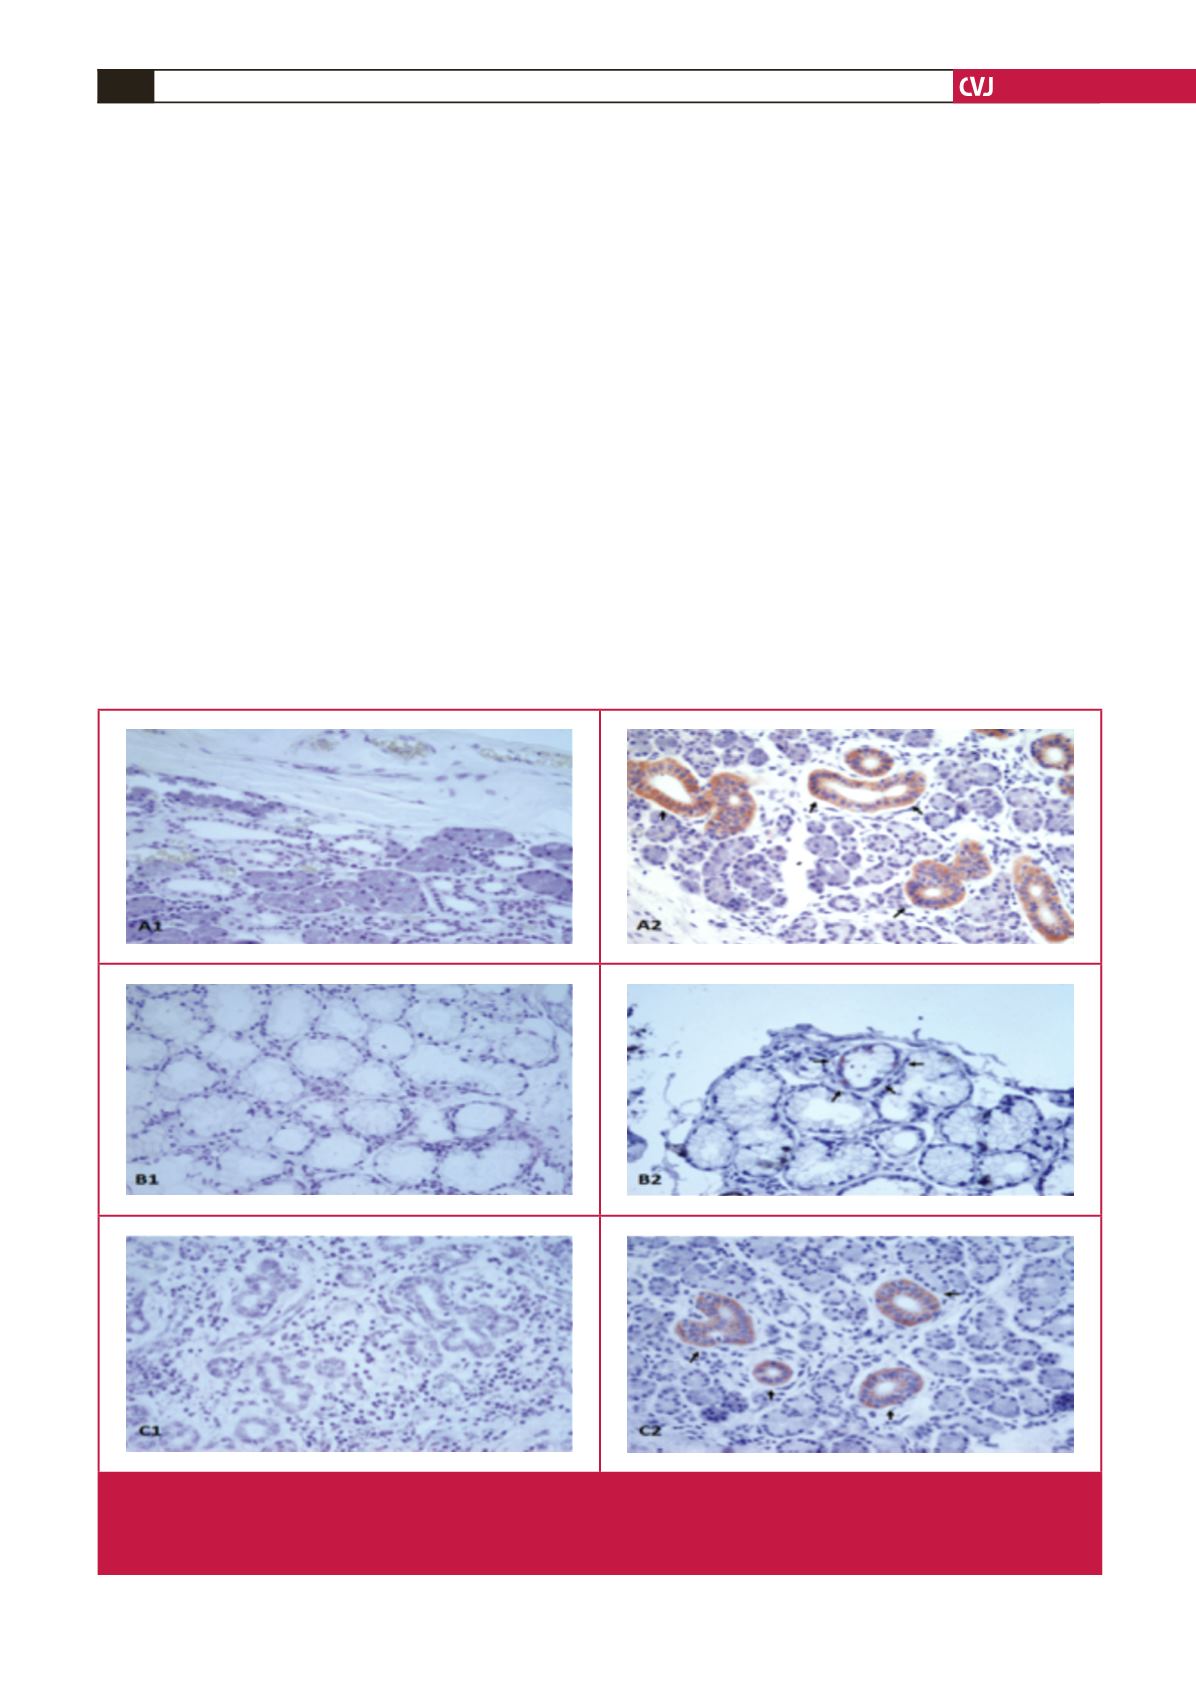
Salivary glands were obtained from the Department of
Pathology. They had been removed by surgeons only because
of calcification. Adropin was screened immunohistochemically
using the Hsu
et al
. avidin–biotin peroxidase complex (ABC)
method, as recently described.
26
Adropin primary antibody was
diluted 1/200 (rabbit polyclonal anti-adropin antibody, ab12800;
Abcam, Cambridge, UK), applied and incubated for 60 min in a
humid chamber at room temperature.
Immunostained sections from the parotid, submandibular
and sublingual glands were examined with an Olympus BX 50
photomicroscope. Immunohistochemical staining was scored for
both intensity and prevalence on a scale of 0 to
+
3 (0: absent,
+
1:
weak,
+
2: medium,
+
3: strong).
Statistical analysis
All statistical analyses were performed using SPSS for Windows
version 21.0 (SPSS Inc, Chicago, USA). Differences between groups
were analysed with the Kruskal–Wallis test. The Mann–Whitney
U
-test was used to compare parameters within groups. Comparisons
of mean values between groups were expressed as
±
2 SEM.
Fig. 1.
Adropin immunohistochemistry of the intercalated duct of the parotid, striated and interlobular ducts of the submandibular,
and mucous acinus of the sublingual glands. A1, parotid negative; A2: parotid adropin immunoreactivity; B1, sublingual nega-
tive; B2: sublingual adropin immunoreactivity, C1, submandibular negative; C2, submandibular adropin immunoreactivity. Red
colour shows adropin immunoreactivity. Magnification
×
400.


