
CARDIOVASCULAR JOURNAL OF AFRICA • Volume 28, No 1, January/February 2017
44
AFRICA
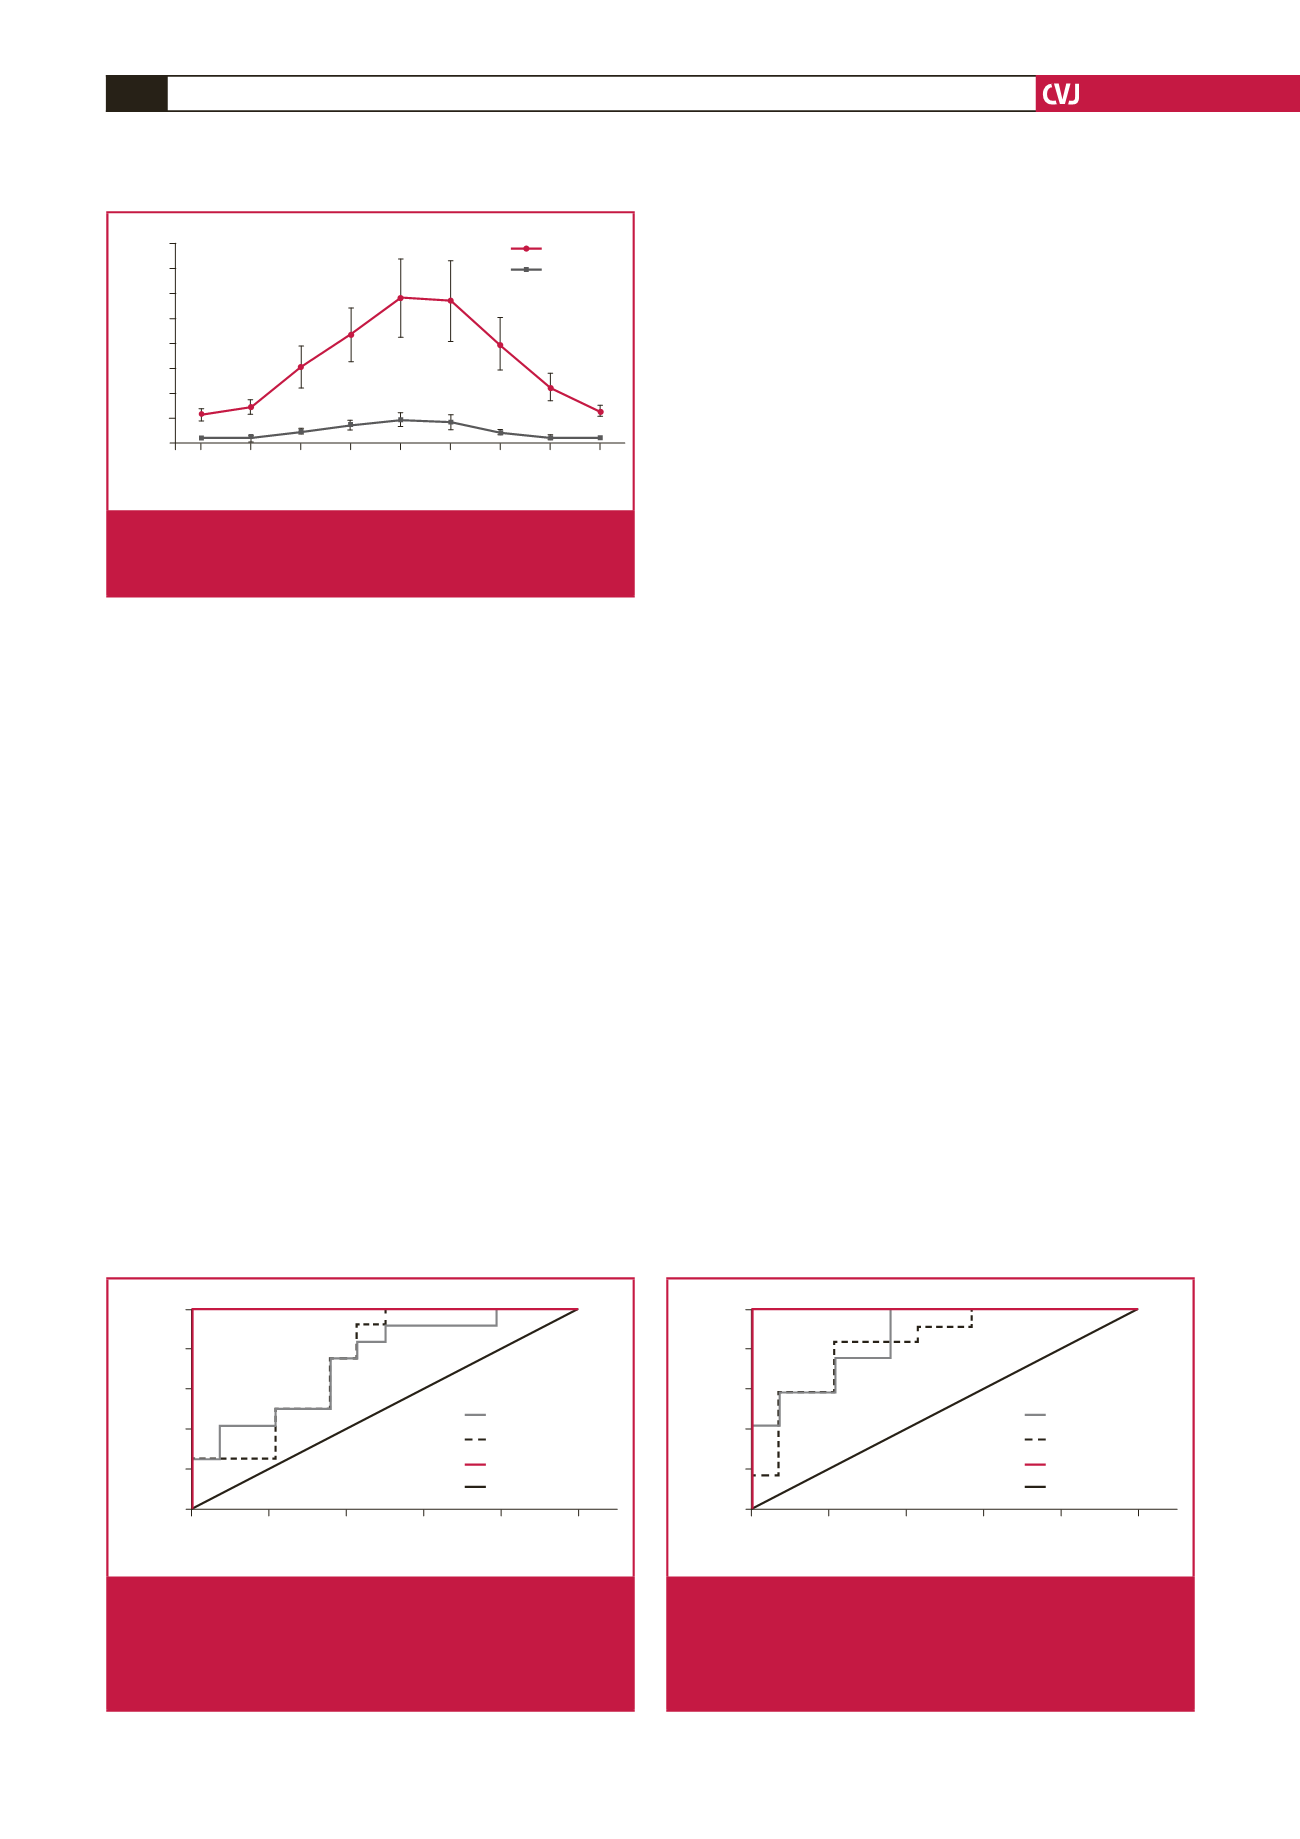
30–40 minutes after EPACS (zero time sample: blood taken
immediately on admission) and peaked at six hours, thereafter
decreasing up to 72 hours. The concentration of CK was
significantly higher than the controls from two hours up to 48
hours in the EPACS patients (Fig. 4).
At four hours after EPACS, the serum adropin concentration
measurement had a sensitivity of 91.7% and specificity of 50% at
a confidence interval of 95% when the cut-off value was set at 4.12
ng/ml (Fig. 5). At six hours after EPACS, with the cut-off value set
to 5.37 ng/ml adropin for serum, the sensitivity was 91.7% and the
specificity 64% (Fig. 6). At four hours after EPACS, saliva adropin
exhibited 91.7% sensitivity and 57% specificity at a confidence
interval of 95%, when the cut-off value was 4.12 ng/ml. At six
hours after EPACS, when the cut-off value was 4.12 ng/ml, the
same sensitivity and specificity were found as at four hours for
saliva adropin level. Serum troponin I exhibited 100% sensitivity
and 100% specificity at a confidence interval of 95% when the
cut-off value was 0.141 ng/ml at four hours after EPACS, and when
the cut-off value was 0.226 ng/ml at six hours after EPACS (Fig. 6).
Discussion
Cardiovascular diseases are the leading cause of death in
both developed and developing countries. The World Health
Organisation predicts that by 2020, 37% of all deaths worldwide
will be from CVDs.
22
Health innovations are widely used, but
ACS, a lethal manifestation of CVD, remains the leading cause
of death worldwide.
28
Currently, cardiac biomarkers (especially
cTI and cTnT) are the most important diagnostic laboratory
tests for ACS.
8
Each year worldwide a million patients with
suspected ACS are admitted to emergency, cardiology and
cardiovascular surgery departments but only around 10% of
cases are then confirmed.
9
Therefore, an accurate, precise and
rapid diagnostic test for EPACS is needed to save lives.
In this context, recent animal studies and a human study have
suggested that adropin could be useful for diagnosing EPACS
in addition to other cardiac biomarkers, but these studies were
controversial.
19,20
Therefore the ability of adropin to identify
cardiac injury earlier than is possible with current biomarkers
should be re-investigated and the controversy resolved. In the
present study, therefore, we measured serum cardiac marker
enzymes and timed serum and saliva adropin concentrations in
EPACS patients and in age- and gender-matched controls.
Troponin I, CK, CK-MB and adropin concentrations
gradually increased in the EPACS group from up to six hours to
levels higher than in the controls (
p
<
0.05), and troponin I and
CK-MB continued to increase for up to 12 hours after EPACS.
After 12 hours, CK and adropin levels started to decrease for up
to 72 hours. These findings confirmed the value of the classical
parameters of troponin I, CK and CK-MB for diagnosing
EPACS in clinical practice.
Saliva adropin concentrations changed in parallel with
serum adropin concentrations in ACS. The saliva adropin
concentration was generally higher than the serum adropin,
possibly because the salivary glands produce adropin (see
below). Since adropin is expressed in many tissues, including
the heart, all contributing to the serum pool, we had assumed
that serum adropin concentration increased after EPACS, as do
troponin I or CK-MB, which are released from the myocardium,
mainly during EPACS and necrosis following heart injury.
9
Our clinical results agree with our previous animal
experiments, showing that adropin concentration gradually rose
above control levels in EPACS patients. This is in contrast to Yu
et al
., who found that serum adropin levels were significantly
lower in EPACS patients than in SAP patients or controls.
20
Yu
et
Hours
0 2 4 6 12 24 48 72
Concentration (IU/l)
800
700
600
500
400
300
200
100
0
Control
c
c
b
c c
c
c a
CK
CK-MB
c
c c
c
b
Fig. 4.
Differences in serum CK and CK-MB concentrations
between EPACS and control subjects.
a
p
<
0.05 and
b,c
p
<
0.01 compared with control.
1 – Specificity
0
0,2
0,4
0,6
0,8
1,0
Sensitivity
1,0
0,8
0,6
0,4
0,2
0
Serum adropin
Saliva adropin
Serum troponin I
Reference
Fig. 5.
Sensitivity and specificity of serum and saliva adropin
and serum troponin I for detecting EPACS at four
hours. The area under the ROC curve, adropin sensi-
tivity of 91.7% and specificity of 67%, were identified
when the cut-off was set at 5.37 ng/ml adropin.
1 – Specificity
0
0,2
0,4
0,6
0,8
1,0
Sensitivity
1,0
0,8
0,6
0,4
0,2
0
Serum adropin
Saliva adropin
Serum troponin I
Reference
Fig. 6.
Sensitivity and specificity of serum and saliva adropin
and serum troponin I for detecting EPACS at six hours.
The area under the ROC curve, adropin sensitivity of
91.7% and specificity of 50%, were identified when the
cut-off was set at 4.43 ng/ml adropin.


