
CARDIOVASCULAR JOURNAL OF AFRICA • Volume 28, No 1, January/February 2017
AFRICA
43
The correlation between serum adropin levels and other clinical
characteristics in EPACS patients was measured as the Spearman
correlation coefficient, or a chi-squared value when appropriate.
Probability values were considered significant at
p
<
0.05.
Results
Immunohistochemical studies revealed no adropin
immunoreactivity in the negative controls (secondary antibody
omitted or phosphate-buffered saline used) for the parotid (Fig.
1A1), sublingual (Fig. 1B1) and submandibular (Fig. 1C1)
glands, but when the adropin antibody was used, there was
reactivity (red colour) in all three salivary glands (Fig. 1A2,
intercalated duct immunoreactive to adropin antibody; Fig. 1B2,
mucous acinus immunoreactive to adropin antibody; Fig.1C2,
striated duct, interlobular duct immunoreactive to adropin
antibody) as distinguished histologically.
Table 1 shows the differences in glucose and lipid profiles
(TC, HDL-C, LDL-C and TG) in subjects with and without
EPACS. Glucose levels in EPACS patients were higher than in
the controls but still within the normal range. Lipid profiles were
not affected by EPACS (Table 1).
Validation of the EIA kit (cat no: EK-032-35) showed it
to be as sensitive to saliva adropin as to serum adropin. The
lowest detectable adropin concentration in saliva was 0.01 ng/
ml, with intra-assay (within day) and inter-assay (between days)
variations of less than 10 and 12%, respectively. Assay recovery
was between 98 and 106%. The response to salivary adropin was
linear over the range 0.50–16.5 ng/ml. Therefore, the sensitivity
and specificity of the EIA kit were the same for saliva as for
serum adropin concentrations.
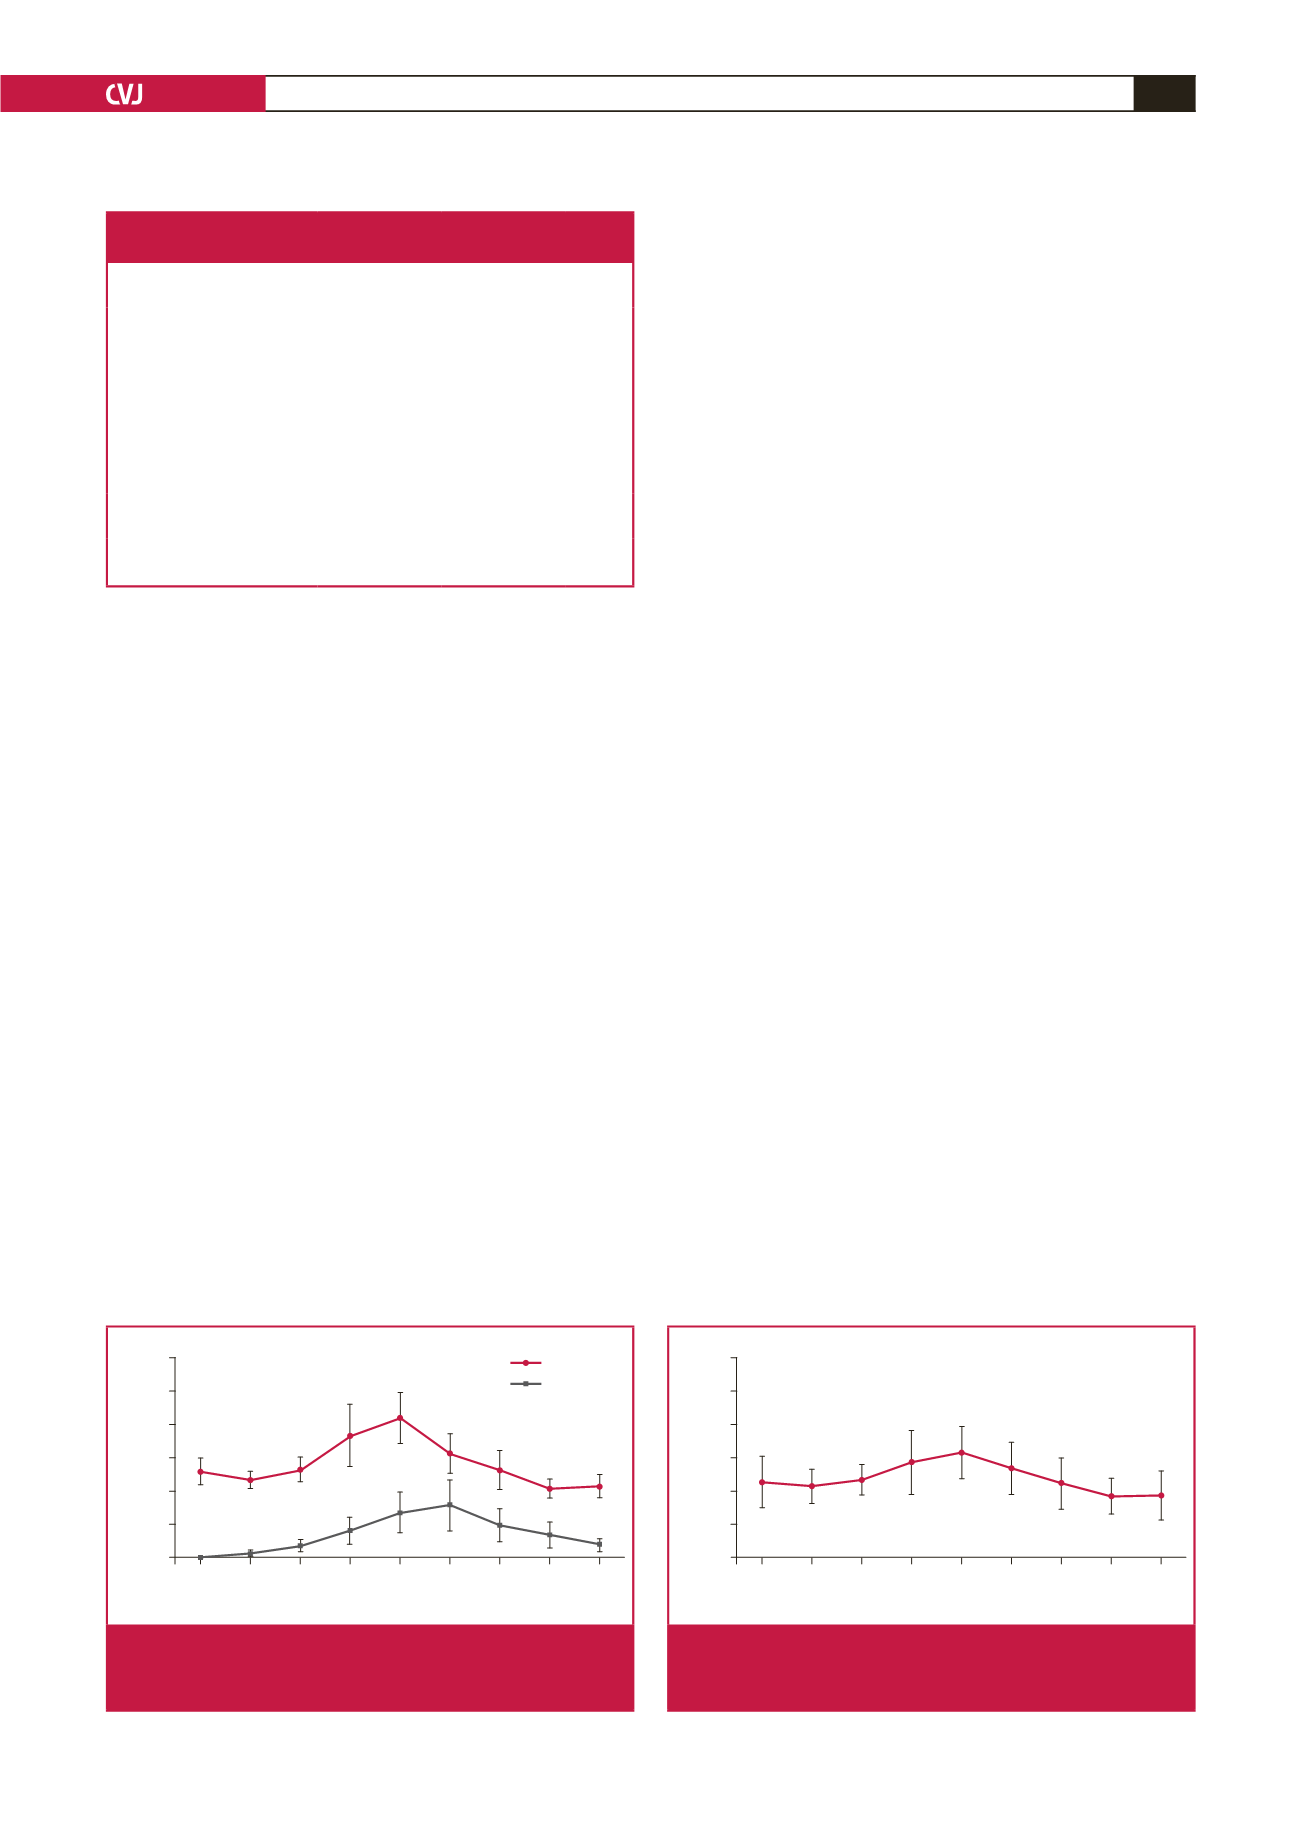
The serum adropin concentration was slightly (insignificantly)
lower in samples taken within 30 minutes (zero time) of patient
admission, than the corresponding control value and stable
coronary diseases (0.67–0.8 ng/ml;
n
=
9). It rose within two hours
post infarct and peaked at six hours; the adropin concentrations
at four and six hours post infarct were significantly higher
than the controls. At 12 and 24 hours post infarct, the levels
were also higher than the corresponding control values but not
significantly so (Fig. 2).
The serum troponin I concentration rose within 30 minutes
(zero time: blood taken immediately after the patient was
admitted to hospital), peaked at 12 hours post infarct, and
remained significantly higher than the controls for up to 72
hours (Fig. 2). The time course of changes in adropin level
paralleled that of troponin I. These findings demonstrate that
serum adropin might help, in conjunction with troponin levels,
in the early diagnosis of EPACS.
The saliva adropin concentration was also slightly lower than
the controls (not statistically significant) in samples taken within
30 minutes (zero time) of hospital admission. Like the serum
adropin concentration, saliva adropin then rose within two
hours post infarct and peaked at six hours, being significantly
higher than the controls at four and six hours, and remaining
elevated at 12 and 24 hours post infarct (Fig. 3). These results
show that serum and saliva adropin concentrations increased
and decreased in parallel in EPACS patients.
Serum adropin levels were positively correlated with saliva
adropin levels (
r
=
0.763,
p
≤
0.01) but with neither glucose
level nor lipid profiles. There was also a correlation between
serum adropin and cTnT levels (
r
=
0.68,
p
=
0.000). Therefore,
measuring saliva adropin levels may be an alternative to
measuring serum adropin concentrations for diagnosing EPACS
or metabolic diseases, for example, diabetes, in which adropin
regulates energy homeostasis and insulin resistance.
27
Serum CK and CK-MB levels were also measured. The
initial statistically significant rise in CK-MB above control
concentrations occurred within 30–40 minutes (zero time) after
the onset of chest pain, peaked at six hours, and returned to
baseline at 72 hours. CK levels also started to increase within
Table 1. Changes in glucose and lipid profiles with and
without EPACS. All values are presented as mean
±
SD.
Parameters
Control
(
n
=
24)
EPACS
(
n
=
22)
p
-value
Age (years)
40.57
±
5.0 57.75
±
6.38 0.000
Male/female
12/12
12/10
0.713
Glucose (mg/dl)
(mmol/l)
89.07
±
6.27
(4.94
±
0.35)
102.08
±
19.24
(5.67
±
1.07)
0.039
Total cholesterol (mg/dl)
(mmol/l)
178.93
±
42.82
(4.63
±
1.11)
212.13
±
44.82
(5.49
±
1.16)
0.111
HDL-C (mg/dl)
(mmol/l)
43.42
±
9.2
(1.12
±
0.24)
40.4
±
7.06
(1.05
±
0.18)
0.535
LDL-C (mg/dl)
(mmol/l)
106.14
±
31.69
(2.75
±
0.82)
130.25
±
37.65
(3.37
±
0.98)
0.105
Triglycerides (mg/dl)
(mmol/l)
172.93
±
57.37
(1.95
±
0.65)
200.33
±
86.16
(2.26
±
0.97)
0.354
Hours
0 2 4 6 12 24 48 72
Concentration (ng/ml)
12
10
8
6
4
2
0
Control
a
b
c
c
c
c
c
c
c
c
Adropin
Troponin I
Fig. 2.
Differences in serum adropin and troponin I concentra-
tions between EPACS and control subjects.
a
p
<
0.05
and
b,c
p
<
0.01 compared with control.
Hours
0 2 4 6 12 24 48 72
Saliva adropin levels (ng/ml)
12
10
8
6
4
2
0
Control
a b
Fig. 3.
Differences in saliva adropin concentrations between
EPACS and control subjects.
a
p
<
0.05 and
b
p
<
0.01
compared with control.


