


 34 / 76

CARDIOVASCULAR JOURNAL OF AFRICA • Volume 29, No 4, July/August 2018
232
AFRICA
magnetic resonance imaging (MRI)
15
and evaluated in conditions
such as hypertension,
16
ischaemic heart disease
17
and a variety
of cardiomyopathies.
18
In CKD, LV twist has been shown
to increase as calculated glomerular filtration rate (GFR)
decreased.
19-21
A major limitation of the above studies on LV
twist is that the impact of varying loading conditions in patients
undergoing haemodialysis was not evaluated.
The aim of this pilot study was to examine LV twist in
African patients with stage 5 CKD before and after a single
haemodialysis session.
Methods
This prospective, longitudinal, single-centre study was
conducted at the Chris Hani Baragwanath Hospital Renal
Unit in Johannesburg, South Africa. Volunteers were screened
from November 2010 until February 2011. Inclusion criteria
were: ages between 20 and 65 years and documented CKD on
intermittent haemodialysis three times weekly. Exclusion criteria
were: pre-existing cardiac disease, known coronary artery disease,
valvular heart disease, arrhythmias, and poor echocardiography
windows that precluded speckle tracking.
Of the 71 patients receiving intermittent haemodialysis in
this unit, 26 meeting the entry criteria were recruited among
volunteers (Fig. 1). Similarly, 26 age- and gender-matched
individuals were recruited fromhealthy volunteers with no known
underlying medical conditions among unrelated staff members
at Chris Hani Baragwanath Hospital and local churches around
the Soweto, Johannesburg area.
22
Ethics approval for this studywas obtained from theUniversity
of the Witwatersrand human research ethics committee. Written
informed consent was obtained from all patients, and the study
protocol (approval number M10510) conformed to the 1975
Declaration of Helsinki.
Patients with CKD with end-stage kidney failure (ESKF)
were on three-times-a-week intermittent haemodialysis (HD).
Haemodialysis was performed for an average of four hours with
mean ultrafiltration volume of 2.2
±
0.9 litres, using bicarbonate
dialysate. Fresenius FX dialysers were used, with most patients
dialysed on the FX 80 dialysers, although the range of dialysers
used were FX 60, FX 80 and FX 100, according to the patient’s
weight.
The recombinant erythropoietin, epoetin-beta, was used
to maintain haemoglobin levels at a target of 11 to 12 g/dl, in
keeping with KDIGO guidelines at the time. An average of
12 000 units was given subcutaneously per patient per week.
Eighty-eight per cent of patients receiving haemodialysis were
on an ACE inhibitor or angiotensin receptor blocker, with the
most frequently used agents being perindopril and telmisartan.
All 52 participants underwent complete transthoracic
echocardiographic evaluation. CKD patients were evaluated
before and within an hour of a single haemodialysis session.
According to a standardised protocol used by our institution,
22-25
a comprehensive echocardiographic examination was performed
in the lateral decubitus position using a commercially available
system (iE33 xMATRIX, Philips Healthcare, Andover, MA,
USA) equipped with an S5-1 transducer (frequency transmitted
1.7 MHz, frequency received 3.4 MHz). Measurements obtained
were averaged from three heartbeats. All data were transferred to
an Xcelera workstation (Phillips Healthcare) for offline analysis.
Chamber size measurements and function were performed
according to the American Society of Echocardiography (ASE)
chamber quantification guidelines of 2006.
26,27
EF was calculated
using LV volumes with the modified biplane Simpson’s rule, in
keeping with guidelines.
26
Diastolic function was evaluated and
analysed in accordance with the ASE 2009 guidelines.
28
Left ventricular end-diastolic volume (LVEDV) was taken
as representative markers of preload. Pulse pressure over stroke
volume (PP/SV) was used as a surrogate of arterial stiffness,
29,30
which takes into account the contributions of systemic vascular
resistance (SVR) and ventricular compliance to afterload.
31
PP/SV has previously been validated as a measure of arterial
stiffness and afterload in trials such as the LIFE study.
32
Mean
arterial pressure (MAP) was used as an indirect marker for
afterload as it is a major contributor to SVR.
Speckle-tracking basal images were obtained in the parasternal
short axis at the level of the mitral valve, showing the tips of
leaflets with the most circular image possible. Apical images were
acquired by moving the transducer one or two spaces caudally,
using a method described by van Dalen.
33
Images were acquired at a frame rate of 50–80 frames/s during
sinus rhythmwith less than 10%variability in heart rate for optimal
speckle tracking.
18
These images were reviewed and analysed by
a cardiologist experienced in STE, using QLAB Advanced
Quantification software (Version 8.0, Philips Healthcare).
9,34
Tracking points were placed within the myocardium to avoid
the pericardium. In keeping with ASE/European Association of
Echocardiography (EAE) consensus,
35
counter-clockwise rotation
was assigned a positive value and clockwise rotation a negative
value as viewed from the apex (Figs 2, 3).
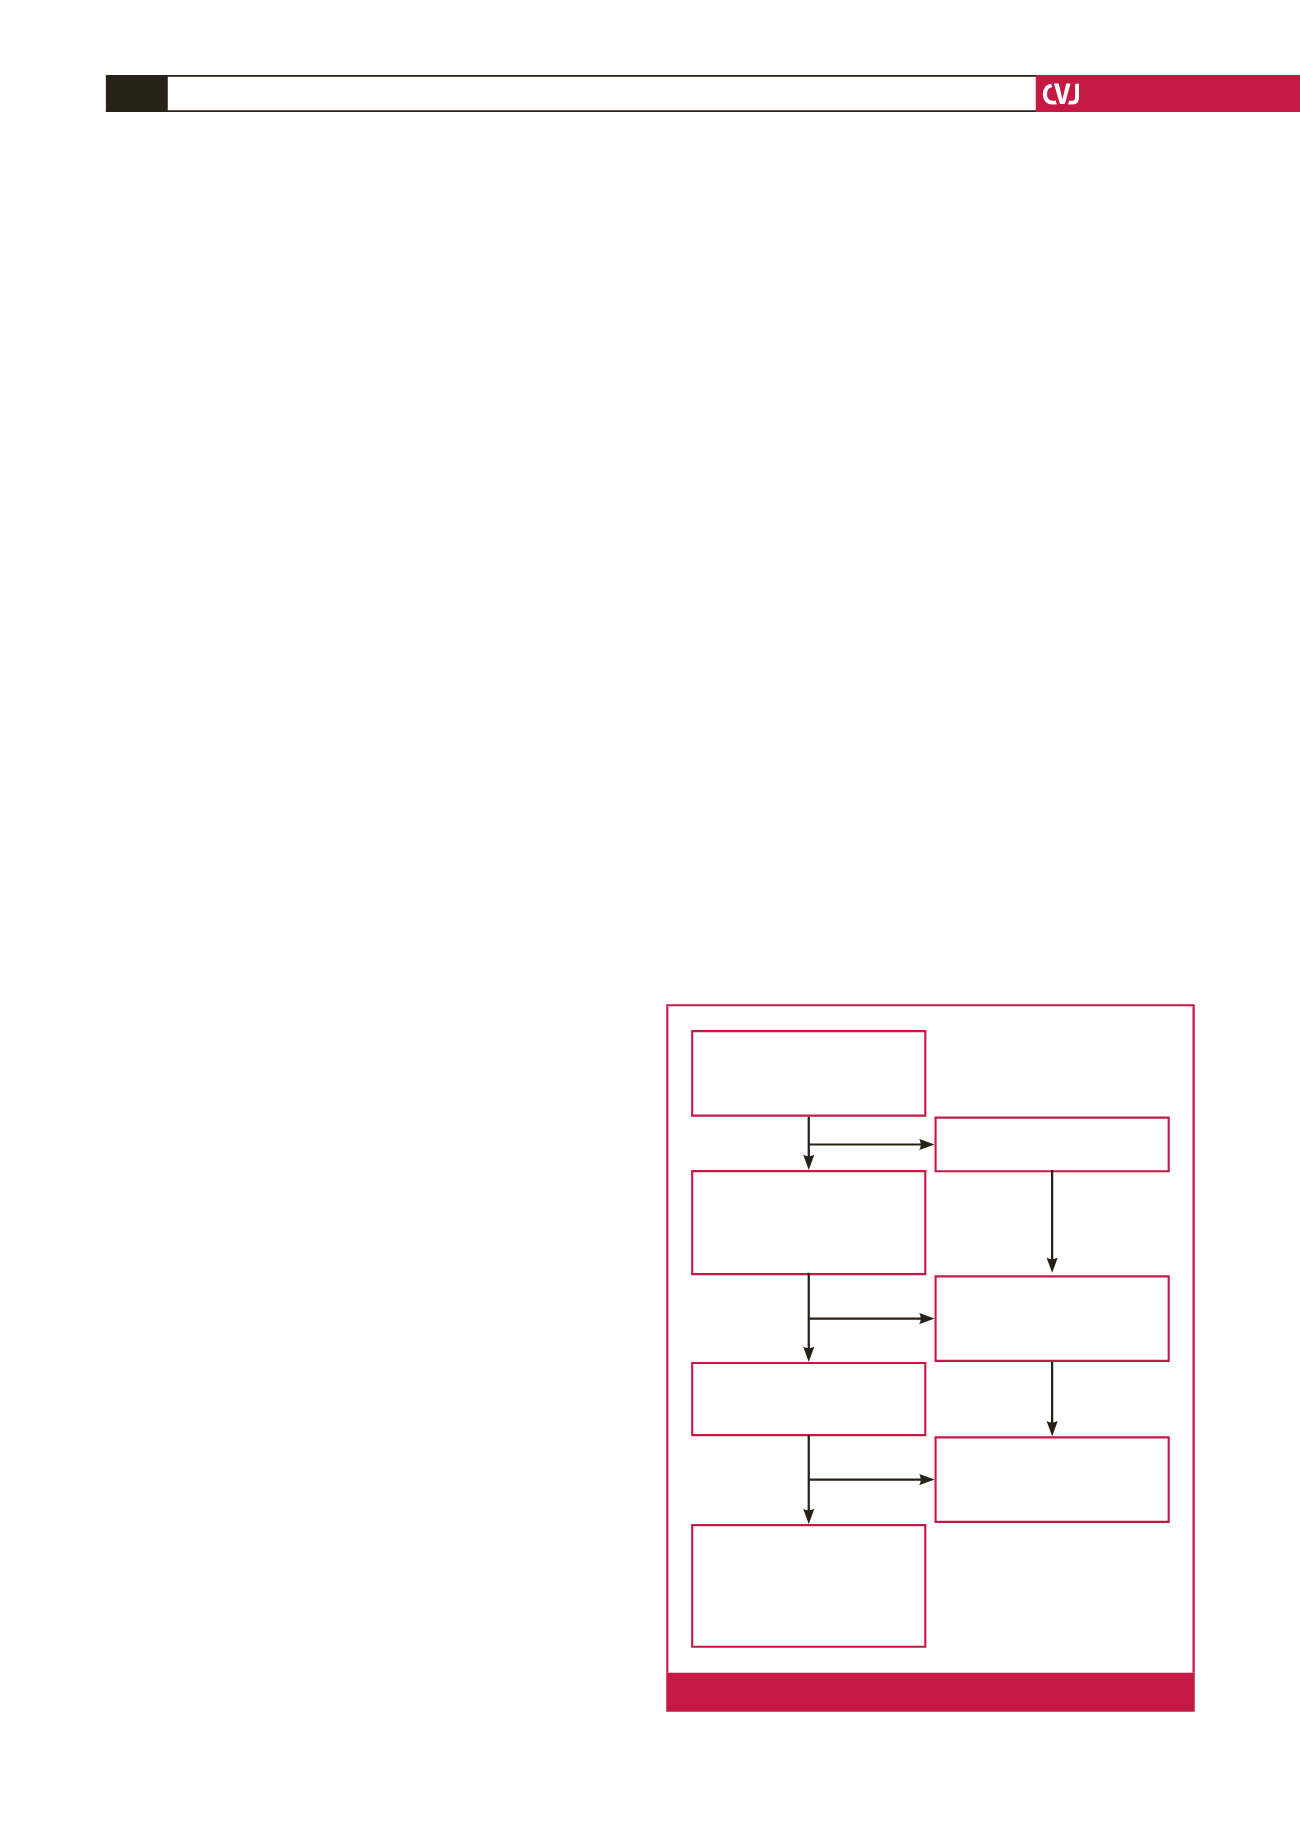
Chris Hani Baragwanath
Hospital haemodialysis unit
71 patients attending morning,
afternoon or evening shift
30 patients refused consent due
to difficulties with transport
41 patients with
informed consent and
preliminary screening and
echocardiography performed
before and after dialysis
8 patients excluded with
pre-existing cardiac disease
such as valvular heart disease
or did not meet entry criteria
33 patients’ echocardiography
performed with speckle tracking
analysis performed
26 haemodialysis with pre- and
post-dialysis echocardiography
images and speckle-tracking
imaging included for final
analysis with age- and gender-
matched controls
7 patients had more than two
segments that did not track
adequately using speckle-
tracking
Fig. 1.
Flow chart of patient recruitment.