


 35 / 76

CARDIOVASCULAR JOURNAL OF AFRICA • Volume 29, No 4, July/August 2018
AFRICA
233
Peak apical rotation was measured during the ejection systolic
phase. Basal rotation was measured at a time isochronous to peak
apical systolic rotation, in keeping with a standard protocol used
by our institution, which has previously been published.
22,24,25
Net
instantaneous twist was calculated as peak apical rotation minus
the isochronous basal rotation.
Measurements were independently made by two cardiologists
trained in STE. The combined mean inter-observer variability
for measurements of apical, basal and net twist of renal
patients pre-dialysis was 3.67% (range 2–37%) and post-dialysis
3.7% (range 2.5–31%). The mean intra-observer variability
pre-dialysis was 2.76% (range 2–10%) and post-dialysis 3.72%
(range 2.5–26%).
Statistical analysis
Data were analysed using the Statistica version 11 (Statsoft;
Tulsa, Oklahoma, USA) program. Results are expressed as means
with standard deviations or medians for non-normal distribution
or frequencies, and percentages for categorical variables. To
assess differences between the control groups versus pre-dialysis
patients, and control versus post-dialysis patients, the Mann–
Whitney test for non-normally distributed variables was used.
Pre-dialysis and post-dialysis comparisons were performed with
the Wilcoxon matched paired test. Significance was assumed
at two-sided values of
p
< 0.05. Fisher’s exact test was used to
compare categorical data. The Schapiro–Wilk test was used to
assess normality. Univariate linear regression analysis was used
to identify independent factors associated with twist pre-dialysis
and post-dialysis, and change in twist.
Results
Clinical characteristics of control participants and CKD patients
are summarised in Table 1. The mean ages of control versus
CKD patients were 44.0
±
11.4 versus 43.4
±
12.2 years (
p
=
0.81), with a 46% male incidence in both groups. The most
common aetiology of the CKD patients was hypertension (81%).
Weight (mean 66.2
±
8.5 vs 65.2
±
12.9 kg;
p
=
0.44), body mass
index (BMI) and body surface area (BSA) were similar between
the groups (Table 1). By contrast, with the CKD patients, the
pre-dialysis systolic blood pressure, diastolic blood pressure,
mean arterial pressure and pulse pressure were significantly
higher compared to levels observed in the control group
(Table 1).
On echocardiography, patients on haemodialysis had
significantly higher pre-dialysis LV diastolic volumes, LV
end-systolic volumes, LV end-systolic diameter (LVESD) and
stroke volume compared to the controls, whereas there was no
difference in EF and PP/SV (Table 2). In addition, patients on
haemodialysis had significantly thicker LV walls and greater
LV mass compared to controls. LV hypertrophy (LVH) was
present in 88% of renal patients (23 of 26 patients). In those
Table 1. Clinical characteristics of patients and controls
Characteristics
Control
(
n
=
26)
Pre-dialysis
(
n
=
26)
Post-dialysis
(
n
=
26)
Mean age (years)
44.0
±
11.4 43.4
±
12.2
–
Male gender,
n
(%)
12 (46)
12 (46)
–
Height (cm)
163.6
±
8.9 164.0
±
9.6
–
Weight (kg)
66.2
±
8.5 65.2
±
12.9 63.0
±
12.6
†
Change in weight (kg)
–
–
2.2
±
1.0
Haemoglobin (g/dl)
–
9.9
±
2.3
-
Heart rate (beats/min)
70.3
±
11.9 81.8
±
11.9* 89.7
±
18.3
Body mass index (kg/m
2
)
24.7
±
2.5 24.2
±
4.0
–
Body surface area (m
2
)
1.7
±
0.1
1.7
±
0.2
–
Diabetes mellitus,
n
(%)
0
2 (8)*
–
Hypertension,
n
(%)
0
22 (81)*
–
Systolic blood pressure (mmHg)
122.7
±
5.1 151.8
±
17.6* 145.0
±
24.5
Diastolic blood pressure (mmHg)
75.5
±
10.2 90.1
±
14.1* 88.4
±
16.5
Mean arterial pressure (mmHg)
91.2
±
7.4 110.6
±
13.7* 107.4
±
18.0
Pulse pressure (mmHg)
47.2
±
10.3 61.7
±
14.4* 56.6
±
16.3
Volume ultra-filtrated (l)
–
–
2.2
±
0.9
Years on dialysis
–
6.7
±
3.4
–
Corrected calcium (mmol/l)
–
2.3
±
0.3
–
Corrected calcium (g/dl)
–
9.2
±
1.3
–
Phosphate (mmol/l)
–
1.3
±
0.5
–
Phosphate (g/dl)
–
4.1
±
1.7
–
Calcium × phosphate product (g
2
/dl
2
)
–
37.6
±
15.5
–
Parathyroid hormone level (pg/ml)
–
66
±
68
–
*
p
-value < 0.05 vs control group,
†
p
-value < 0.05 vs pre-dialysis group.
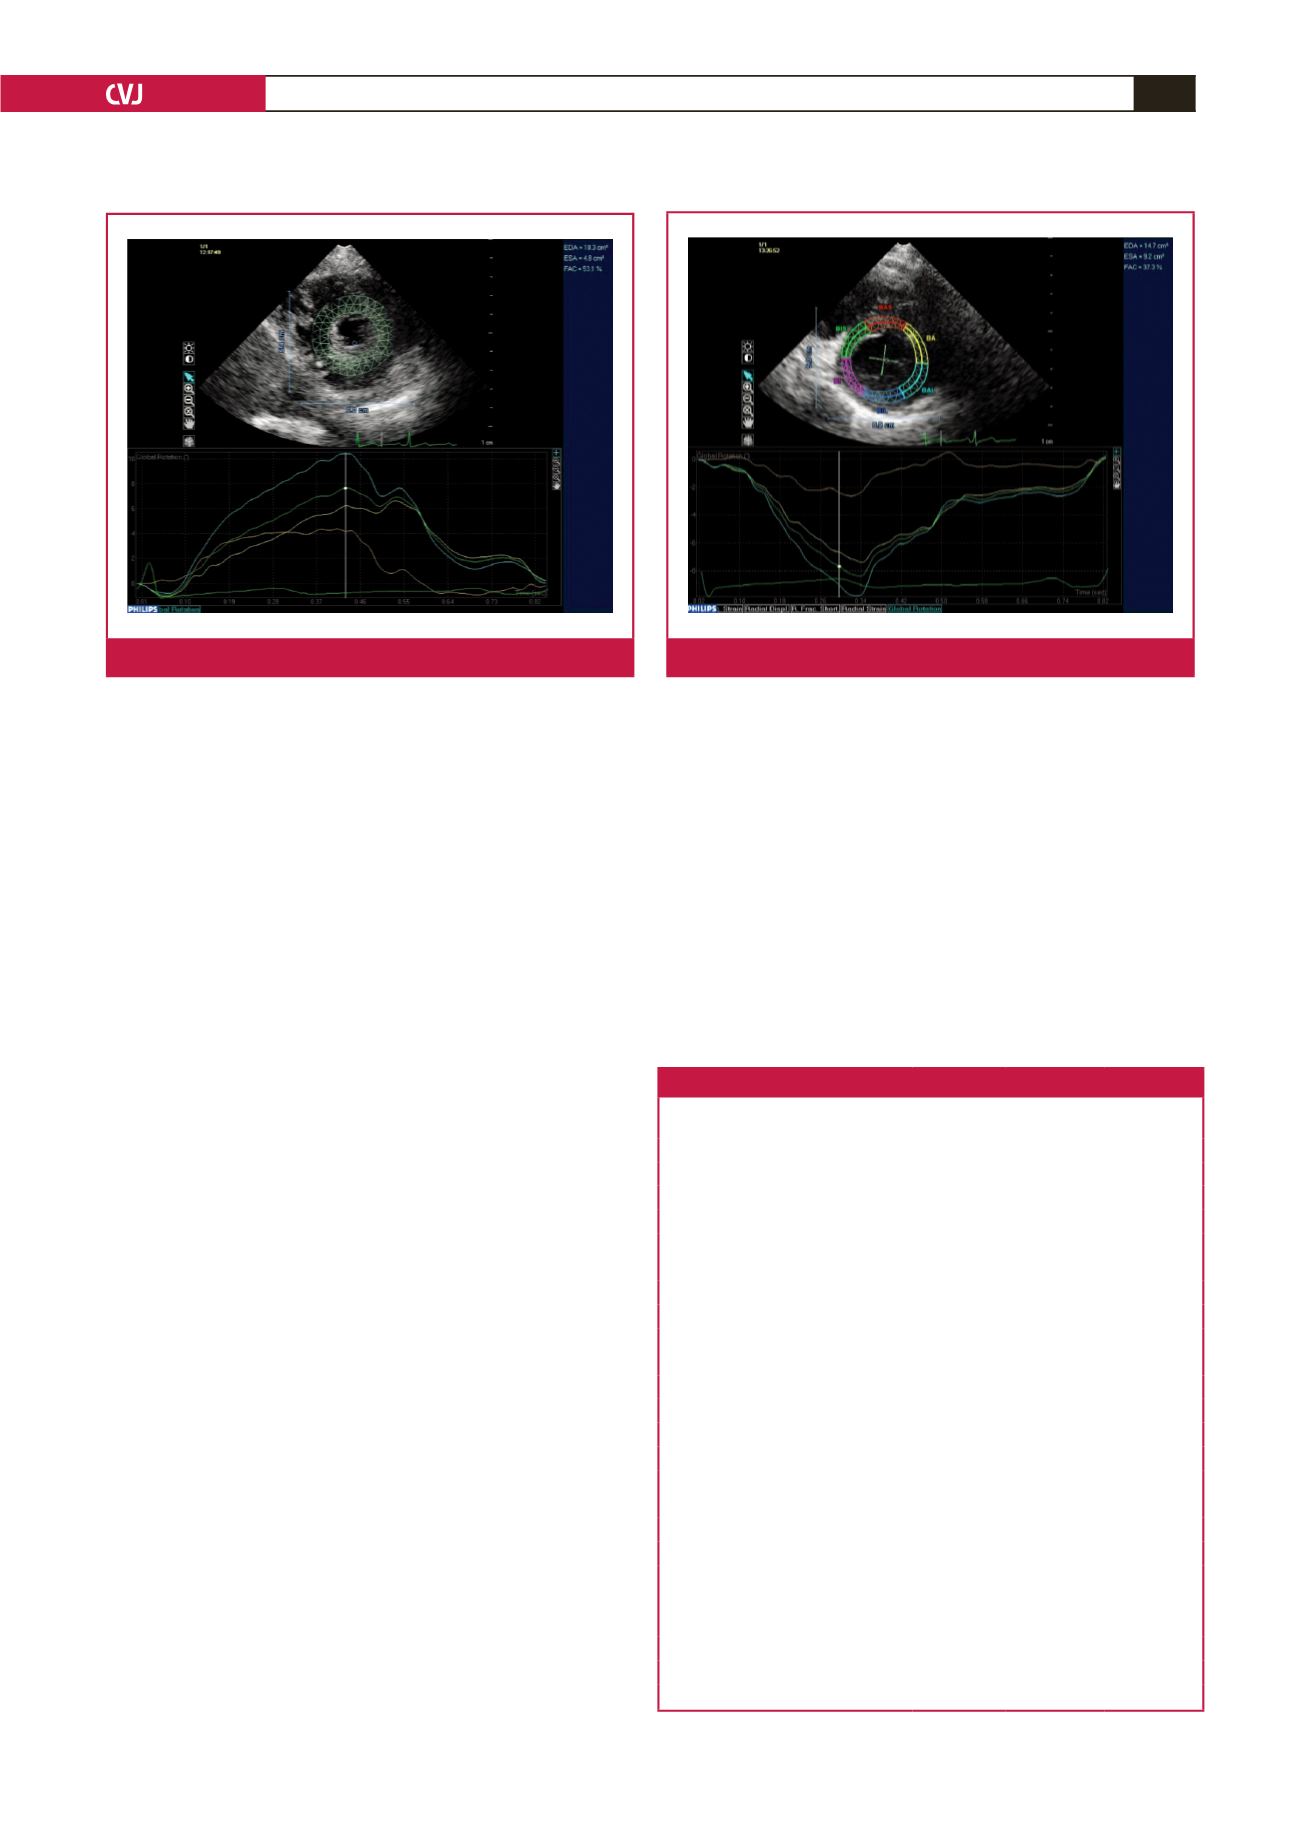
Fig. 3.
Basal rotation in the short-axis view.
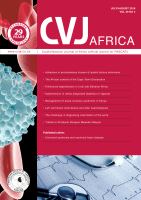
Fig. 2.
Short-axis view through the apex.