


 14 / 74

CARDIOVASCULAR JOURNAL OF AFRICA • Volume 30, No 2, March/April 2019
80
AFRICA
•
Dofetilide (Dof, 5 nM) and 4-AP (5.0 mM) were added to the
superfusion to block
I
Kr,
I
KUr
, and
I
to
, respectively.
Atrial myocytes from the atrium of SHR were isolated using the
double enzyme method. Briefly, each SHR was anesthetised with
sodium pentobarbital (40 mg/kg), followed by anticoagulation
with heparin (300 U/kg i.p.). The heart was removed immediately,
suspended on a Langendorff apparatus, and then perfused via
the aorta. The atrial tissue was digested with Tyrode’s solution,
containing type II collagenase (1.4 mg/ml, Invitrogen, USA)
and trypsinase (0.24 mg/ml, Merck, Germany) for 15–20 min.
Then the atrial tissue was cut into small pieces and placed in a
dish containing Kreb’s buffer solution. Dispersion of dissociated
cardiac myocytes was facilitated by light shaking or blowing. All
solutions were continuously gassed with 95% O
2
and 5% CO
2
and
were maintained at 37°C.
HEK 293 cells (ATTC, Manassas, VA, USA) were maintained
under 5% CO
2
in humidified air at 37°C, as indicated, for
biochemical analysis. Transient transfection of SCN5A-F1473S,
SCN5A-T535I and SCN5A-E1784K mutations and 2.0
μ
g WT
cDNA plasmids pcDNA3.1 into the cultured cells was performed
using lipofectamine (Life Technologies, Gaithersburg, MD,
USA) as per the manufacturer’s instructions. GFP cDNA was
co-transfected as a reporter gene. After six hours, the transfection
medium was replaced with the regular HEK293 medium.
GFP-positive cells, identified using confocal imaging, were patch-
clamped for recording 48 to 72 hours after transfection.
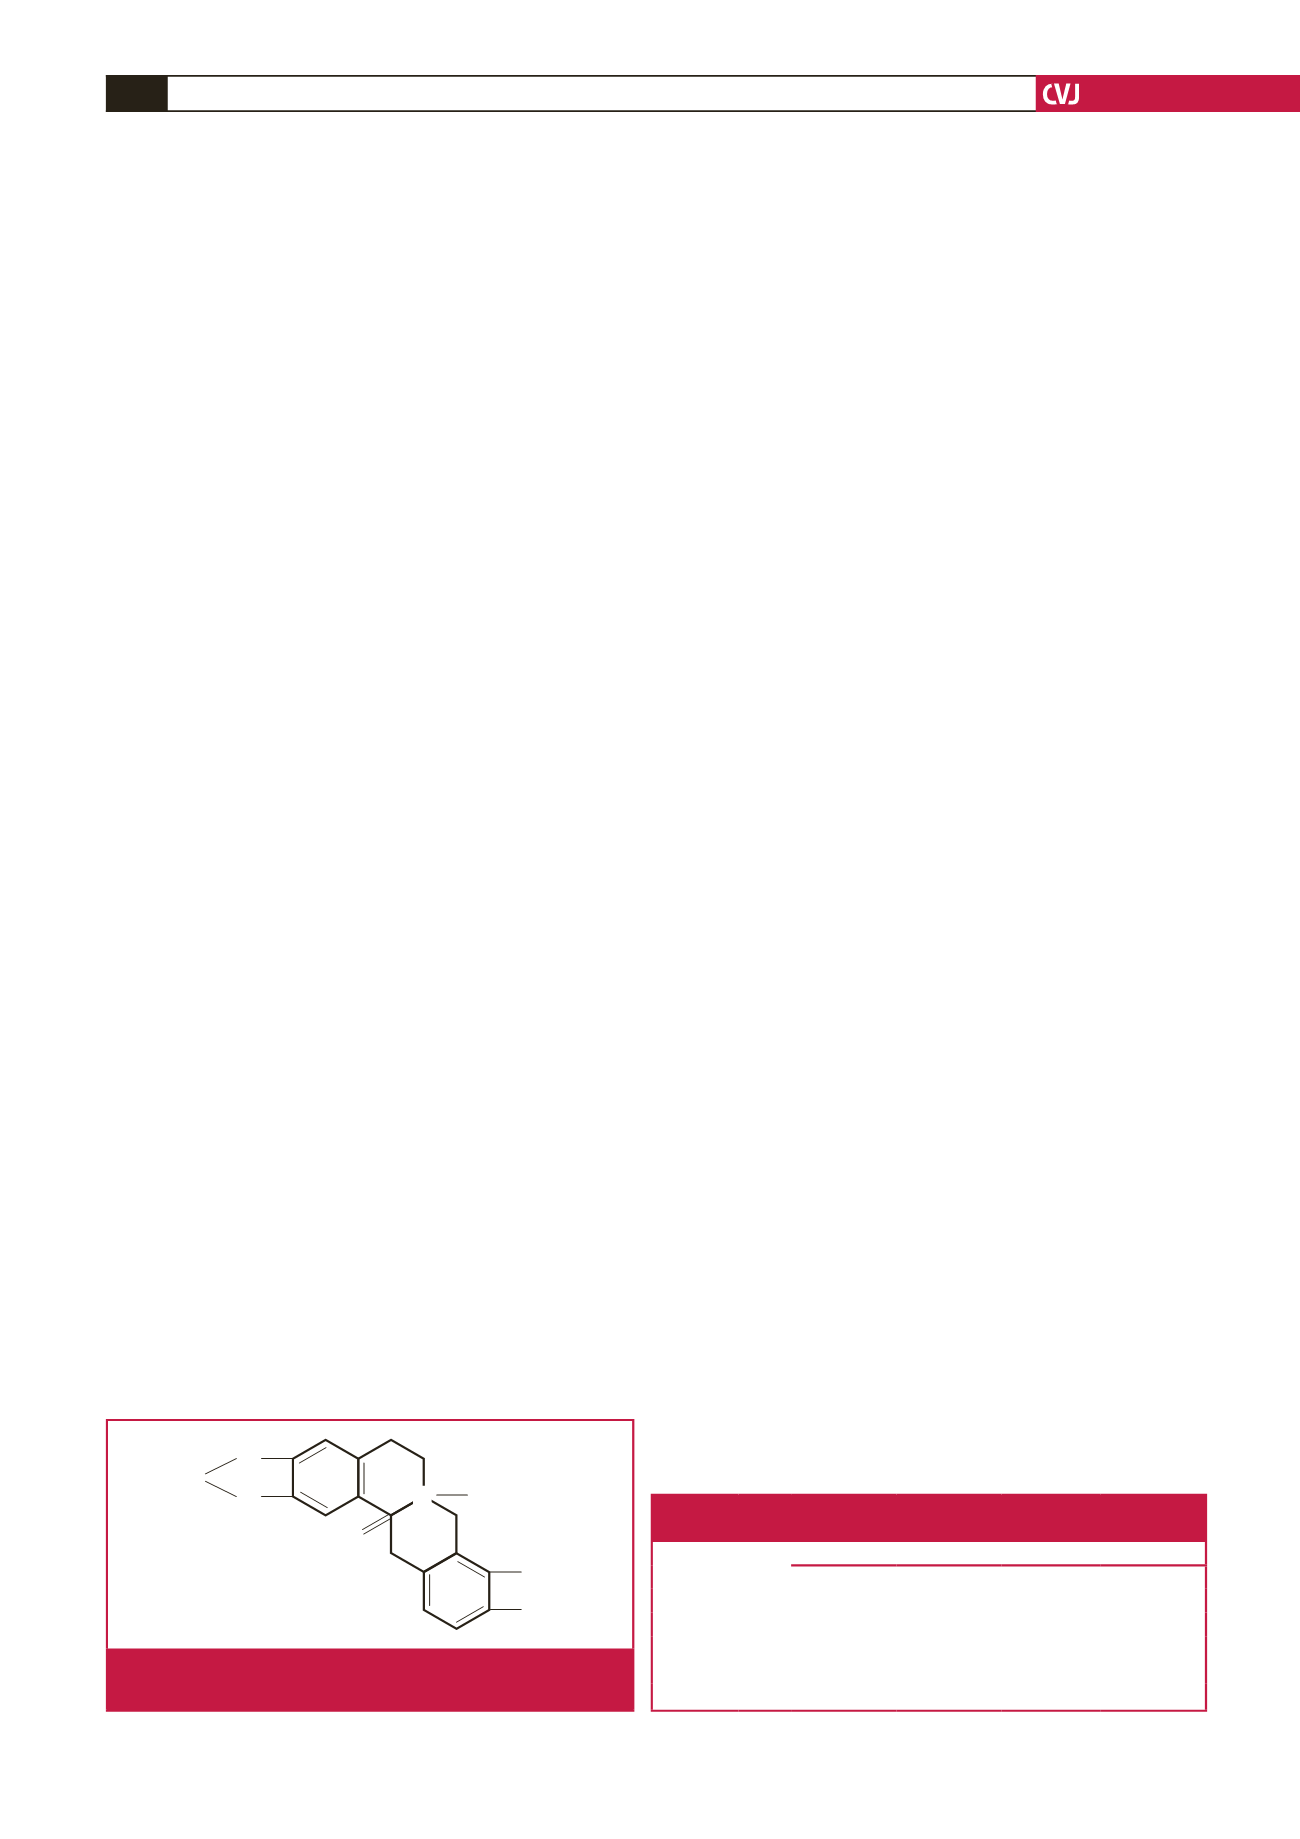
All (molecular weight 365) was obtained from the
Pharmaceutical Department of Lanzhou University. It is a
white crystal powder at 99.0% purity; its structure is illustrated
in Fig. 1. In this study, the maximum concentration of All was
selected as 0.5 mM; the drug was dissolved in dimethyl sulfoxide
(DMSO) to obtain a stock solution of 1.0 M. The drug stock
solution was added to the bath solution to produce the final
concentration (see the Results section). At this final DMSO
concentration (0.1%), no peak or sustained current was affected.
The action potential and current were recorded with the patch-
clamp technique via an Axon-700B amplifier (Axon Instruments,
Inc, Foster City, CA, USA). Current signals were filtered at 3 kHz
through a 16-bit A/D digital converter (Digidata 1440A; sampling
rate: 1.0 kHz; Axon Instruments, Inc). Glass electrodes with tip
resistances of 2.5–5.0 m
Ω
were used for recording. The whole-
cell current was obtained under voltage clamp mode via filtering
at 3.0 kHz and sampling at 10.0 kHz. The action potential was
recorded in current clamp mode. Original recordings are shown
in terms of current amplitude, but mean data are presented as
current density for cell membrane capacitance.
Statistical analysis
Data are presented as the mean
±
SD, with
n
denoting the number
of cells analysed. Clampfit version 10.4 (Axon Instruments, Inc)
and Origin (Microcal Software) were used for data analysis.
The
t
-test was performed for two groups. Multiple groups were
compared using one-way analysis of variance, and significance
between any two groups was evaluated with a Student–Newman–
Keuls
post hoc
test. SPSS 17.0 was used for analyses, with
p
<
0.05 considered statistically significant.
Steady-state activation (SSA) curves were fitted using a
Boltzmann distribution as follows:
G
(t)
____
G
max
=
1
_______________
1 + exp
(V
m
– V
1/2,act
)
_________
k
act
where k
act
is the slope factor and V
1/2,act
is the membrane potential
for half-maximal activation.
Steady-state inactivation (SSI) was fitted using the Boltzmann
equation:
I
(t)
___
I
max
= 1 + exp
(V
m
– V
1/2,inact
)
__________
k
inact
where k
inact
is the slope factor and V
1/2,inact
is the membrane
potential for half-maximal inactivation.
The peak currents were measured and mean data were fitted with
the Hill equation:
I
__
I
0
=
1
____________
1 + ([C]/IC
50
)
nH
where [C] is the drug concentration in the external solution, IC
50
is the half-maximum inhibited concentration, I
0
and I are the
current amplitudes measured in the absence and presence of
drugs, respectively, and nH is the Hill coefficient.
Results
To ensure stability of the animals, we measured their blood
pressure and body weight in the first week. Results revealed
significant differences in blood pressure between the SHR and
WKY groups (
p
<
0.01,
n =
15), whereas the weight of the two
groups neither changed nor differed significantly (Table 1).
Action potential (AP) was elicited using 1 500 pA and a 5-ms
current pulse. Action potential durations (APD
20
, APD
50
and
APD
90
) were recorded at 20, 50 and 90% repolarisation. APD
50
and APD
90
were prolonged in SHR atrial myocytes
(p
<
0.05 or
p
<
0.01,
n =
15). These changes could be partially recovered by
All 30
μ
M (
p
<
0.05 or
p
<
0.01,
n =
15). APD
20
changed slightly
in the three groups. The resting membrane potential and the
AP amplitudes showed no significant difference with 30
μ
M All
treatment (Fig. 2).
CH
2
CH
3
OCH
3
OCH
3
O
O
O
N
+
Fig. 1.
Chemical formula of All, an alkaloid extracted from
Corydalis decumbens
(Thunb.) Pers. Papaveraceae.
Table 1. Systolic blood pressure (SBP) and body weight
of SHR andWKY rats (mean
±
SD)
Day
Parameters Rats
1
3
5
7
SBP
(mmHg)
SHR 175.3
±
10.5** 178.4
±
14.2** 176.9
±
7.9** 179.2
±
13.8**
WKY 122.4
±
6.5 127.1
±
7.9 120.8
±
9.2 126.2
±
5.4
Body
weight (g)
SHR 183.5
±
2.9 186.2
±
4.3 184.9
±
2.1 185.6
±
3.1
WKY 189.4
±
3.4 190.2
±
2.0 187.3
±
4.0 188.5
±
3.4
**
p
<
0.01 vs WKY group.