


 15 / 74

CARDIOVASCULAR JOURNAL OF AFRICA • Volume 30, No 2, March/April 2019
AFRICA
81
Change of late sodium current before and after All
treatment
For I
Na,Late
at steady state, we used a 500-ms depolarisation pulse
before and after treatment with 30
μ
M All. At a test potential of
–20 mV, the I
Na,Late
densities were increased from 0.24
±
0.02 pA/
pF for the WKY cells to 1.73
±
0.04 pA/pF for the SHR cells (
p
<
0.01,
n =
15; Fig. 3A).
After treatment with 30
μ
M All, current densities of SHR
cells decreased to 0.92
±
0.03 pA/pF. The ratios of I
Na,Late
/I
Na,peak
for
the WKY and SHR cells were 0.09
±
0.01% and 0.71
±
0.02%,
respectively. The I
Na,Late
/I
Na,peak
of the SHR group reduced to 0.37
±
0.02% with 30
μ
M All (
p
<
0.01,
n =
15; Fig. 3B).
The I
Na,peak
was elicited using depolarising steps to –40 mV for
500 ms, from a holding potential of –120 mV. Current amplitudes
were normalised to the cellular membrane capacitance in the
form of current densities. Compared with WKY cells, the peak
current densities of SHR cells changed slightly from –248.22
±
25.34 pA/pF to –242.82
±
20.08 pA/pF, and the peak current
density of SHR cells was –245.25
±
17.33 pA/pF in the presence
of 30
μ
M All (Fig. 3C).
Concentration-dependent tests of All on I
Na,Late
(1, 3, 10, 30,
100, 300, and 500
μ
M) were performed. I
Na,Late
was inhibited
by All in a concentration-dependent manner. Plots of the IC
50
obtained for the drug are presented in Fig. 3D. The IC
50
of All
was 16.8
±
2.2
μ
M, and the Hill coefficient was 0.96.
SSA was studied by applying depolarising pulses, ranging
from –100 mV to +40 mV, for 500 ms. Conductance of various
voltage pulses were normalised to the maximum conductance
recorded to obtain the activation curve, which was fitted to a
standard Boltzmann distribution function. The
V
1/2,act
of the SHR
cells showed a slight negative shift compared with WKY cells.
V
1/2
and
k
were not significantly changed with exposure to 30
μ
M All.
SSI was studied by applying 1 000-ms pre-pulses ranging
from –140 to 0 mV, followed by a 100-ms test pulse at –20 mV.
The normalised currents were fitted to a Boltzmann distribution
function. During SSI, a +17.2-mV shift for the SHR cells was
observed compared to the WKY cells. The SSI curve shifted
positively, and then the larger window current appeared. With 30
μ
MAll, the SSI curve shifted negatively, and the window currents
in the SHR cells reduced, as shown in Fig. 4 (
p
<
0.05,
n =
15).
The effect of All on the fast inactivation kinetics of I
Na
was
analysed. Depolarising steps from 2 to 50 ms were tested to
ensure full current decay. Compared with the WKY cell channel,
a significantly longer time constant of the slow component (Tau
2, indicating a decelerated inactivation of the open channel) of
the SHR cells was found over a range from –70 mV to +20 mV.
The fast time constant (Tau 1) proportion of the SHR cells did
not change. Further, Tau 2 from the SHR cells appeared shorter
after exposure to 30
μ
M All, but Tau 1 was not different from
that of the WKY control (Fig. 5A).
With the double-pulse protocol, recovery from the current
inactivation process was measured. Cell currents were pre-pulsed
to –20 mV for 100 ms, according to the interval times (0.5, 1, 2,
5, 10, 20, 50, 100, 200 and 500 ms) at –120 mV, and then stepped
up to –20 mV. The recovery constants of the three groups were
not markedly different (
n =
15; Fig. 5B).
To determine the exact action of All on the late sodium
current, we investigated whether All exerted a direct effect on
three SCNA5A mutations (F1473S-SCN5A, T535I-SCN5A
and E1784K-SCN5A) with a late sodium current in HEK293
cells. The current was induced using 500-ms depolarisations
before and after treatment with 30
μ
M All. Representative
current traces of F1473S-SCN5A, T535I-SCN5A, E1784K-
SCN5A and WT of SCN5A are shown in Fig. 6A. At a test
1 500 pA, 5 ms
30 mV
50 ms
0 mV
WKY
All 30
μ
mol/l
SHR
RMP
WKY
SHR All 30
μ
M
APD
20
(ms)
12
11
10
9
8
7
6
5
4
3
2
1
0
*
#
WKY
SHR All 30
μ
M
APD
50
(ms)
80
70
60
50
40
30
20
10
0
**
##
WKY
SHR All 30
μ
M
APD
90
(ms)
160
140
120
100
80
60
40
20
0
**
##
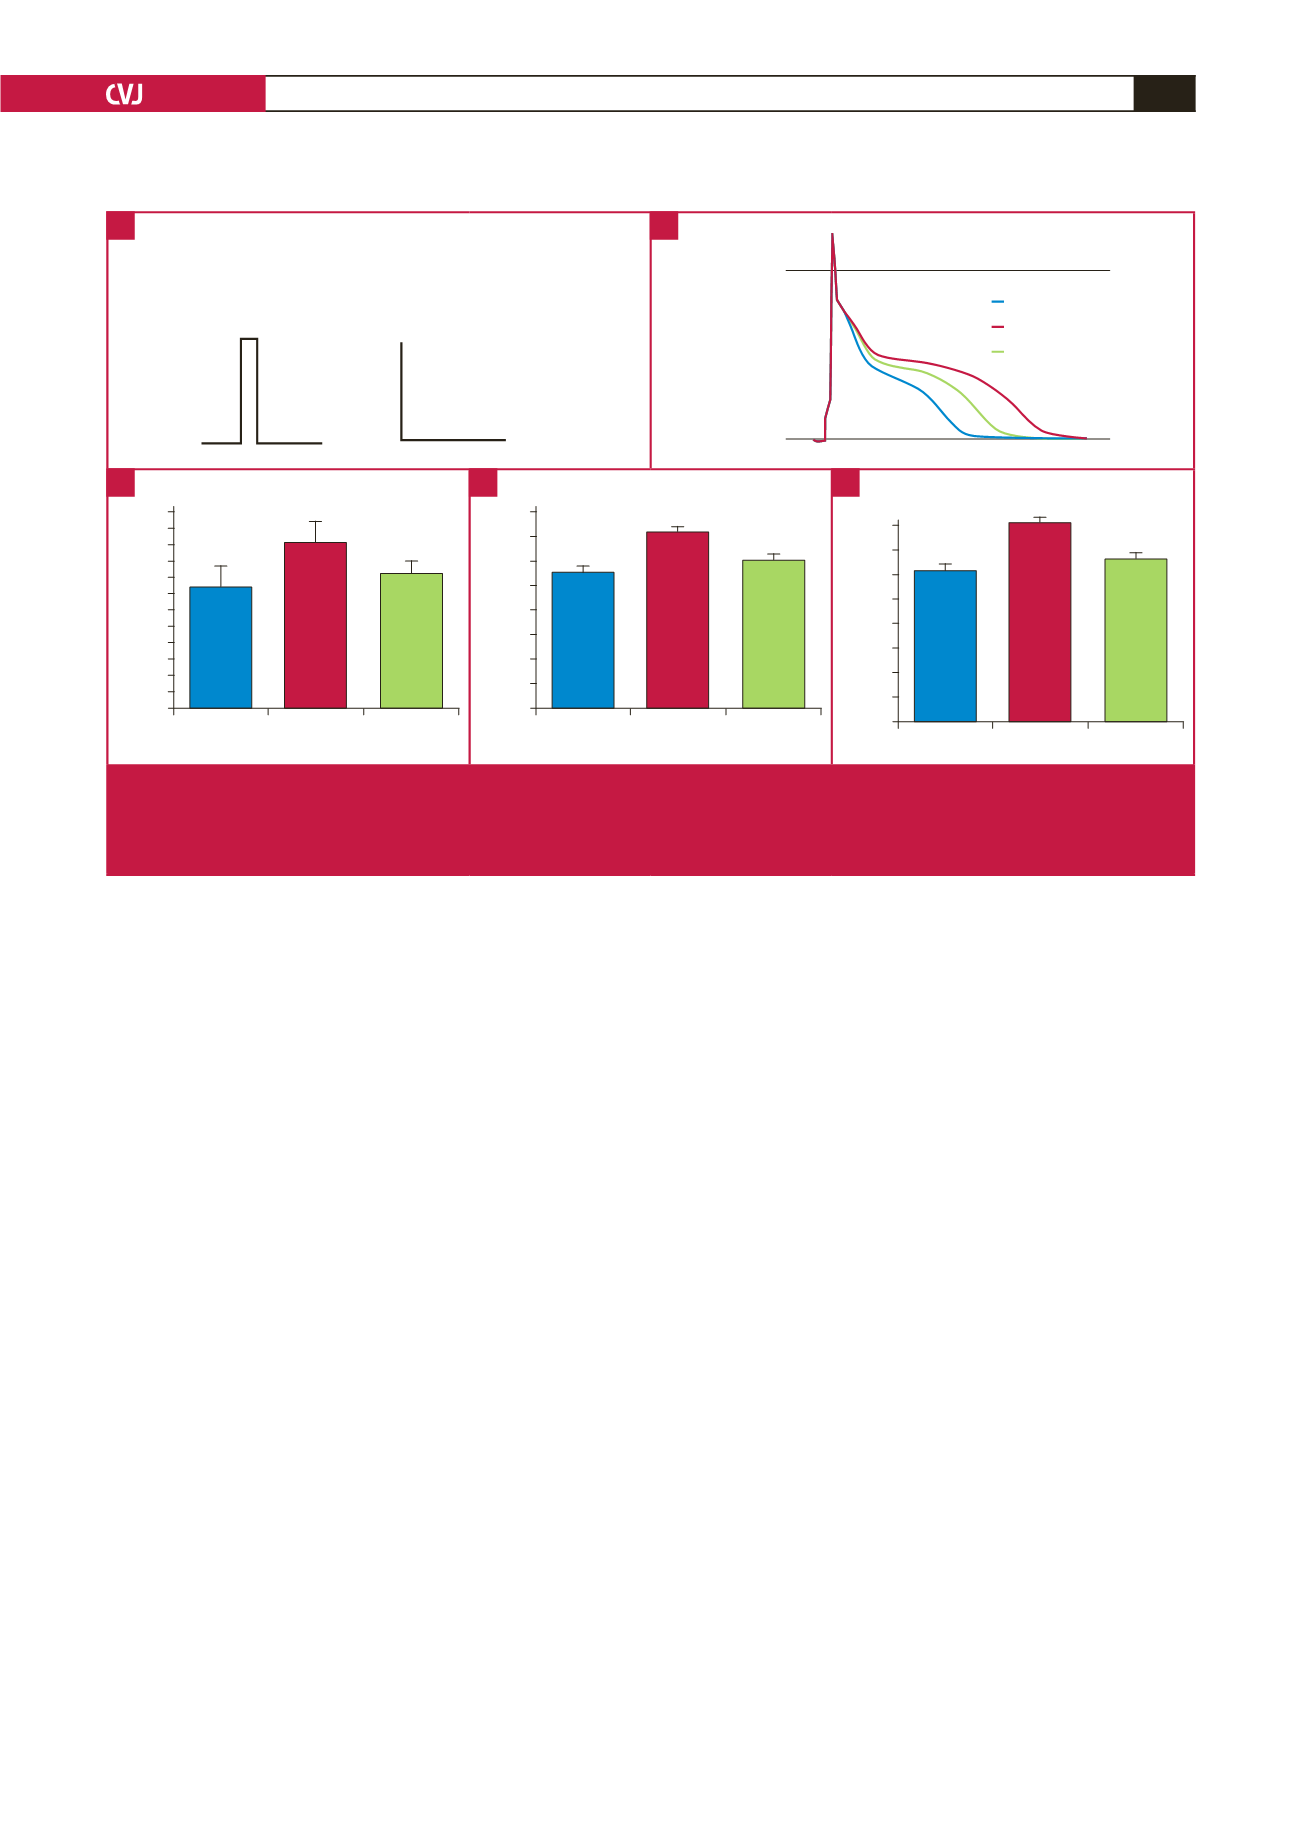
Fig. 2.
Effects of All on AP. (A) Representative AP traces recorded from WKY and SHR cells with 30
μ
M All. I
Na,Late
of SHR myocytes.
(B–D) APD
20
, APD
50
, and APD
90
of atrial myocytes in SHR were markedly prolonged compared to those of WKY cells, which
were significantly shortened after exposure to 30
μ
M All. *
p
<
0.05, **
p
<
0.01 vs WKY group.
#
p
<
0.05,
##
p
<
0.01 vs SHR
group.
A
C
D
E
B