


 17 / 74

CARDIOVASCULAR JOURNAL OF AFRICA • Volume 30, No 2, March/April 2019
AFRICA
83
current, in which an increase in the window current is a driving
mechanism, namely in the overlap of the SSA and SSI of the
sodium channel.
22
The window current is increased by the late
sodium current, thereby extending the APD. The mutations in
SCN5A delay repolarisation, relating to long QT syndrome 3
(LQT3), mostly by increasing I
Na,Late
and increasing the window
current, owing to the right shift in the inactivation curve to slow
the inactivation course of the sodium channel.
23
Our study demonstrated that All greatly reduced the I
Na,Late
of
SHR atrial cells. All caused voltage- and concentration-dependent
I
Na,Late
inhibition with an IC
50
of 16.8
±
2.2
μ
mol/l and a Hill
coefficient of 0.96. All appeared to bind at the binding site of the
cardiac-specific Na channel isoform Nav1.5 with SCN5A coding.
Another LQT3 mutation, F1473S, was reported by Ran
et al
.,
24
showing that an enlarged window current induced an I
Na,Late
that
was not affected by mexiletine (a sodium channel inhibitor).
Test potential (mV)
WKY-SSA
WKY-SSI
SHR-SSA
SHR-SSI
–160 –140 –120 –100 –80 –60 –40 –20 0 20 40 60
Normalised current
1.2
1.0
0.8
0.6
0.4
0.2
0.0
Test potential (mV)
WKY-SSA
WKY-SSI
SHR-SSA-All
SHR-SSI-All
–160 –140 –120 –100 –80 –60 –40 –20 0 20 40 60
Normalised current
1.2
1.0
0.8
0.6
0.4
0.2
0.0
Test potential (mV)
WKY-SSA
WKY-SSI
SHR-SSA
SHR-SSI
–100
–80
–60
–40
–20
0
Normalised current
1.0
0.8
0.6
0.4
0.2
0.0
Test potential (mV)
–100
–80
–60
–40
–20
0
Normalised current
1.0
0.8
0.6
0.4
0.2
0.0
WKY-SSA
WKY-SSI
SHR-SSA-All
SHR-SSI-All
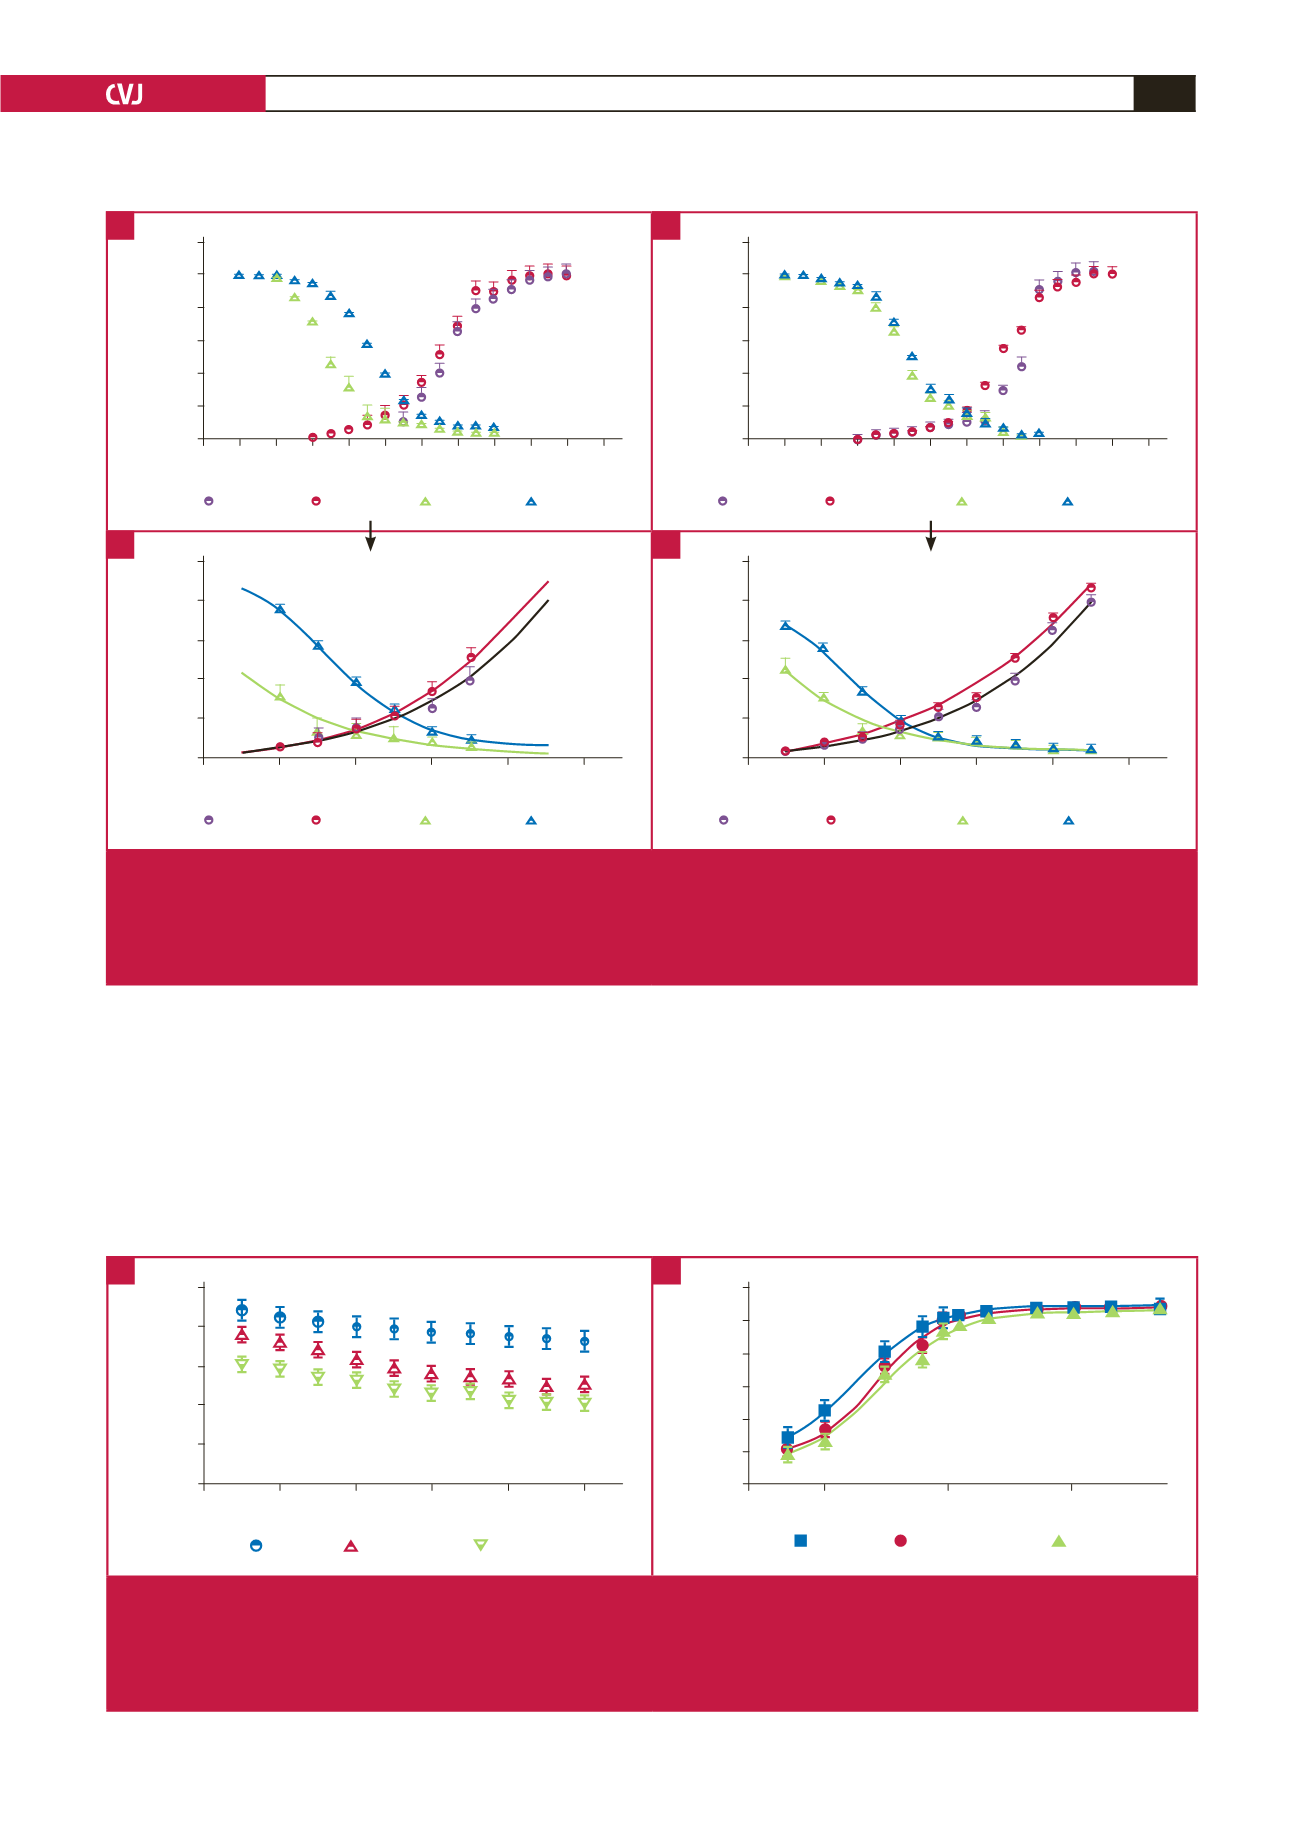
Fig. 4.
Effects of All on steady-state activation (SSA) and steady-state inactivation (SSI) of I
Na
. (A) SSA and SSI curves are shown.
SSI curves differed between WKY and SHR. (B) In the presence of 30
μ
M All, SSI curves were shifted to positive potentials
(
n
=
15). Amplified images of the local graphics from (A) and (B) are shown in (C and D). (C) Larger windows of current of
SHR cells (red crossing line) than that of WKY cells (black crossing line). (D) Windows of current of SHR cells reduced by
30
μ
M All (red crossing line) and close to that of WKY (black crossing line).
A
C
B
D
Test potential (mV)
SHR
WKY
All 30
μ
M/l
–80
–60
–40
–20
0
20
Tau2 of inactivation (ms)
250
200
150
100
50
0
Time (ms)
WKY
SHR
All 10
μ
mol/l
1
10
100
Normalised current
1.2
1.0
0.8
0.6
0.4
0.2
0.0
Fig. 5.
Effect of All on inactivation of kinetic characteristics and recovery from inactivation of currents of SHR. Channel from SHR
cells demonstrated a significantly longer time constant of the slow component (Tau 2) compared with the WKY cell channel
over the entire voltage range from –70 mV to +20 mV. (A) Tau 2 from SHR cells appeared shorter after exposure to 30
μ
M
All (
n
=
15). (B) Recovery curve from inactivation was slightly different in SHR, WKY and All group cells but not statistically
significantly different.
A
B