


 26 / 68

CARDIOVASCULAR JOURNAL OF AFRICA • Volume 31, No 2, March/April 2020
78
AFRICA
by RHC were found to be independent predictors of functional
capacity in PAH patients.
PwD has been used in an extensive list of clinical conditions.
P-wave duration and PwD reveal prolongation of the intra- and
inter-atrial conduction time and inhomogeneous propagation
of sinus impulses, which are well-known electrophysiological
characteristics in patients with atrial arrhythmias and especially
paroxysmal atrial fibrillation.
5
PwD has been used in the
assessment of risk for atrial fibrillation in patients without
obvious heart disease, coronary artery disease, hypertension,
valvular heart diseases, heart failure, congenital heart diseases,
rheumatological diseases and various clinical situations.
5
PwD
has been demonstrated to be a sensitive and specific ECG
predictor of atrial fibrillation in various clinical settings.
5
In our
study, we found a strong correlation between PwD, mPAP and
functional status in PAH patients.
Factors reflecting RV function as assessed by RHC, including
Table 3. Multiple linear regression model to identify independent
predictors of 6MWD test for functional capacity of PAH patients
Model
Unstandardised coefficients
Standardised
coefficients
p-value
B
Std error
Beta
1 (Constant)
694.18
261.15
0.01
TAPSE
–5.33
9.81
–0.09
0.59
ProBNP
–0.007
0.02
–0.05
0.73
PwD
–1.09
0.44
–0.30
0.02
RV size
–13.72
25.29
–0.07
0.59
PVR
8.73
6.06
0.41
0.16
CI
2.61
87.58
0.007
0.97
sPAP echo
–0.68
0.84
–0.16
0.42
Age
0.51
0.91
0.07
0.57
MeanPAPcath
–4.15
1.48
–0.92
0.01
2 (Constant)
699.25
194.06
TAPSE
–5.28
9.43
–0.09
ProBNP
–0.007
0.02
–0.05
PwD
–1.09
0.40
–0.30
RV size
–13.54
24.01
–0.06
PVR
8.66
5.46
0.41
sPAP echo
–0.69
0.80
–0.16
Age
0.53
0.78
0.07
MeanPAPcath
–4.15
1.45
–0.92
3 (Constant)
692.31
189.47
TAPSE
–4.95
9.21
–0.09
0.59
PwD
–1.12
0.39
–0.31
<
0.01
RV size
–13.09
23.54
–0.06
0.58
PVR
8.12
5.15
0.38
0.12
sPAP echo
–0.79
0.73
–0.18
0.29
Age
0.64
0.7
0.09
0.37
MeanPAPcath
–4.06
1.4
–0.9
<
0.01
4 (Constant)
599
74.61
<
0.001
PwD
–1.11
0.38
–0.31
<
0.01
RV size
–13.6
23.18
–0.06
0.56
PVR
8.11
5.07
0.38
0.12
sPAP echo
–0.75
0.72
–0.17
0.30
Age
0.56
0.68
0.07
0.41
MeanPAPcath
–3.76
1.26
–0.83
<
0.01
MeanPAPcath, mean catheter pressure of pulmonary artery; 6MWD, six-
minute walk distance; sPAP echo, systolic pulmonary arterial pressure measured
with echocardiography; TAPSE, tricuspid annular-plane systolic excursion;
ProBNP, N-terminal brain natriuretic peptide; PVR, pulmonary vascular resis-
tance; CI, cardiac index; RV, right ventricular; PwD, P-wave dispersion.
Table 4. Multiple linear regression model to identify independent
predictors of 6MWD test for functional capacity of PAH patients
Model
Unstandardised coefficients
Standardised
coefficients
p-value
B
Std error
Beta
5 (Constant)
565.46
47.33
<
0.001
PwD
–1.2
0.34
–0.33
<
0.01
PVR
7.88
4.99
0.37
0.12
sPAP echo
–0.78
0.71
–0.18
0.27
Age
0.62
0.66
0.08
0.36
MeanPAPcath
–3.83
1.24
–0.85
<
0.01
6 (Constant)
596.5
33.55
<
0.001
PwD
–1.16
0.34
–0.32
<
0.01
PVR
7.79
4.98
0.37
0.129
sPAP echo
–0.64
0.69
–0.15
0.36
MeanPAPcath
–4.1
1.2
–0.91
<
0.01
7 (Constant)
574.83
24.06
<
0.001
PwD
–1.2
0.34
–0.33
<
0.01
PVR
7.20
4.93
0.03
0.15
MeanPAPcath
–4.54
1.108
–1.008
<
0.001
8 (Constant)
578.2
24.42
<
0.001
PwD
–1.37
0.32
–0.38
<
0.001
MeanPAPcath
–3.03
0.41
–0.67
<
0.001
MeanPAPcath, mean catheter pressure of pulmonary artery; 6MWD, six-
minute walk distance; sPAP echo, systolic pulmonary arterial pressure measured
with echocardiography; PVR, pulmonary vascular resistance; PwD, P-wave
dispersion.
Table 5. Correlation between echocardiographic and
ECG parameters in the patient population
TAPSE
RA size
RV size
sPAP echo
PwD
r
–0.31
0.05
0.51
0.36
p
0.07
0.74
< 0.01
0.04
TAPSE, tricuspid annular-plane systolic excursion; RA, right atrial; RV, right
ventricular; sPAP echo, systolic pulmonary arterial pressure measured with
echocardiography; PwD, P-wave dispersion.
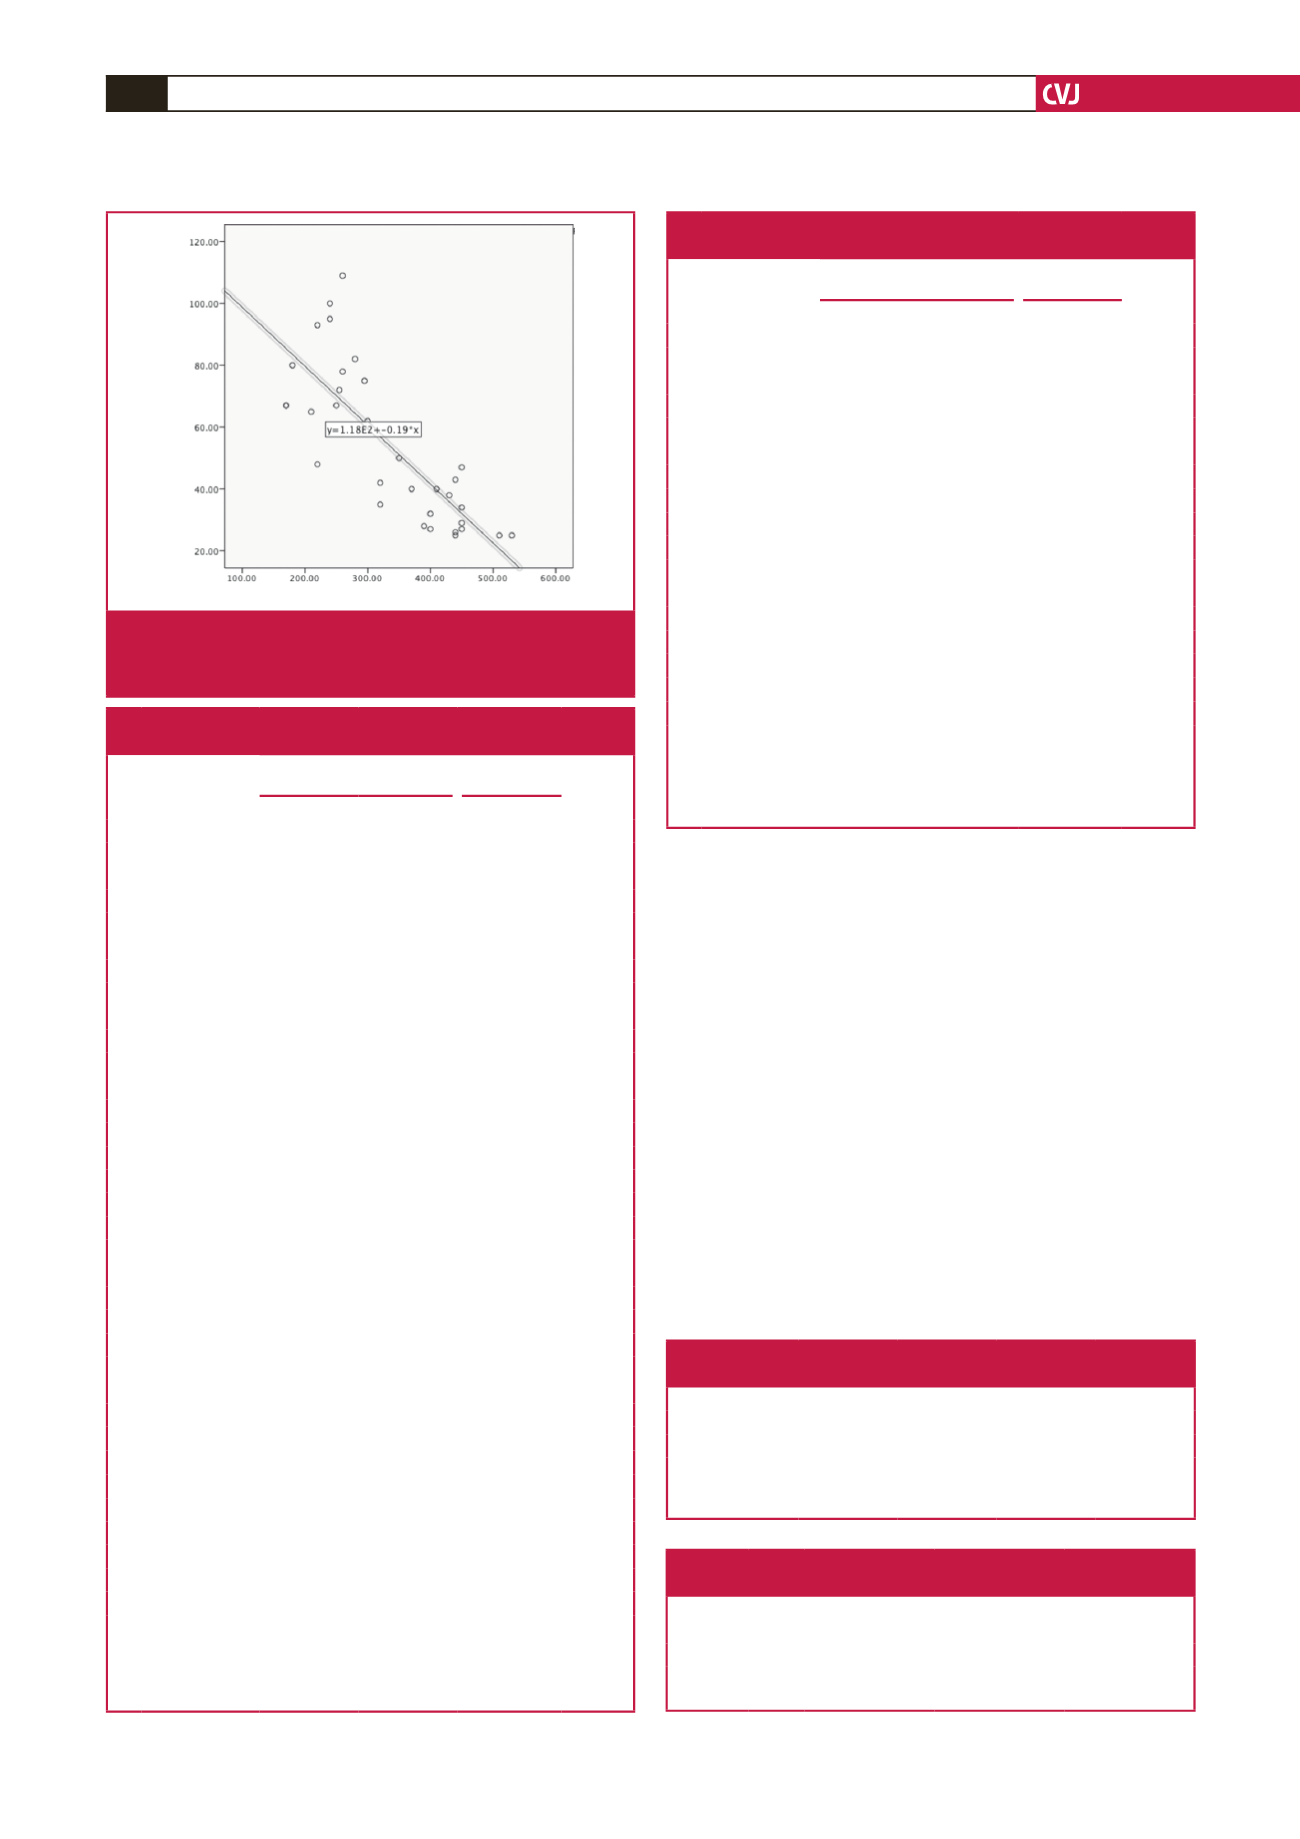
Mean catheter pressure (mmHg)
Six-minute walk distance (m)
R
2
linear = 0.625
Fig. 3.
Correlations between the six-minute walk distance
and mean catheter pressure of the pulmonary artery
in scatterplots.
Table 6. Correlation between echocardiographic and
ECG parameters in the control group
TAPSE
RA size
RV size
PwD
r
–0.22
–0.09
–0.30
p
0.22
0.60
0.09
TAPSE, tricuspid annular-plane systolic excursion; RA, right atrial; RV, right
ventricular; PwD, P-wave dispersion.