


 24 / 68

CARDIOVASCULAR JOURNAL OF AFRICA • Volume 31, No 2, March/April 2020
76
AFRICA
Wolff–Parkinson–White syndrome, supraventricular tachy-
cardia, atrioventricular block and pacemaker rhythm
•
patients with serum electrolyte imbalances and receiving anti-
arrhythmic drugs were excluded due to their possible effects
on ECG measurements.
Details of these patients at the time of diagnosis were analysed,
including gender, age, physical examination, echocardiography,
six-minute walk test distance (6MWD), haemodynamic
parameters and blood tests for biochemical markers that are
correlated with clinical severity.
All standard 12-lead ECGs were recorded with a speed of
25 mm/s and a 10-mm/mV gain on the same day before RHC
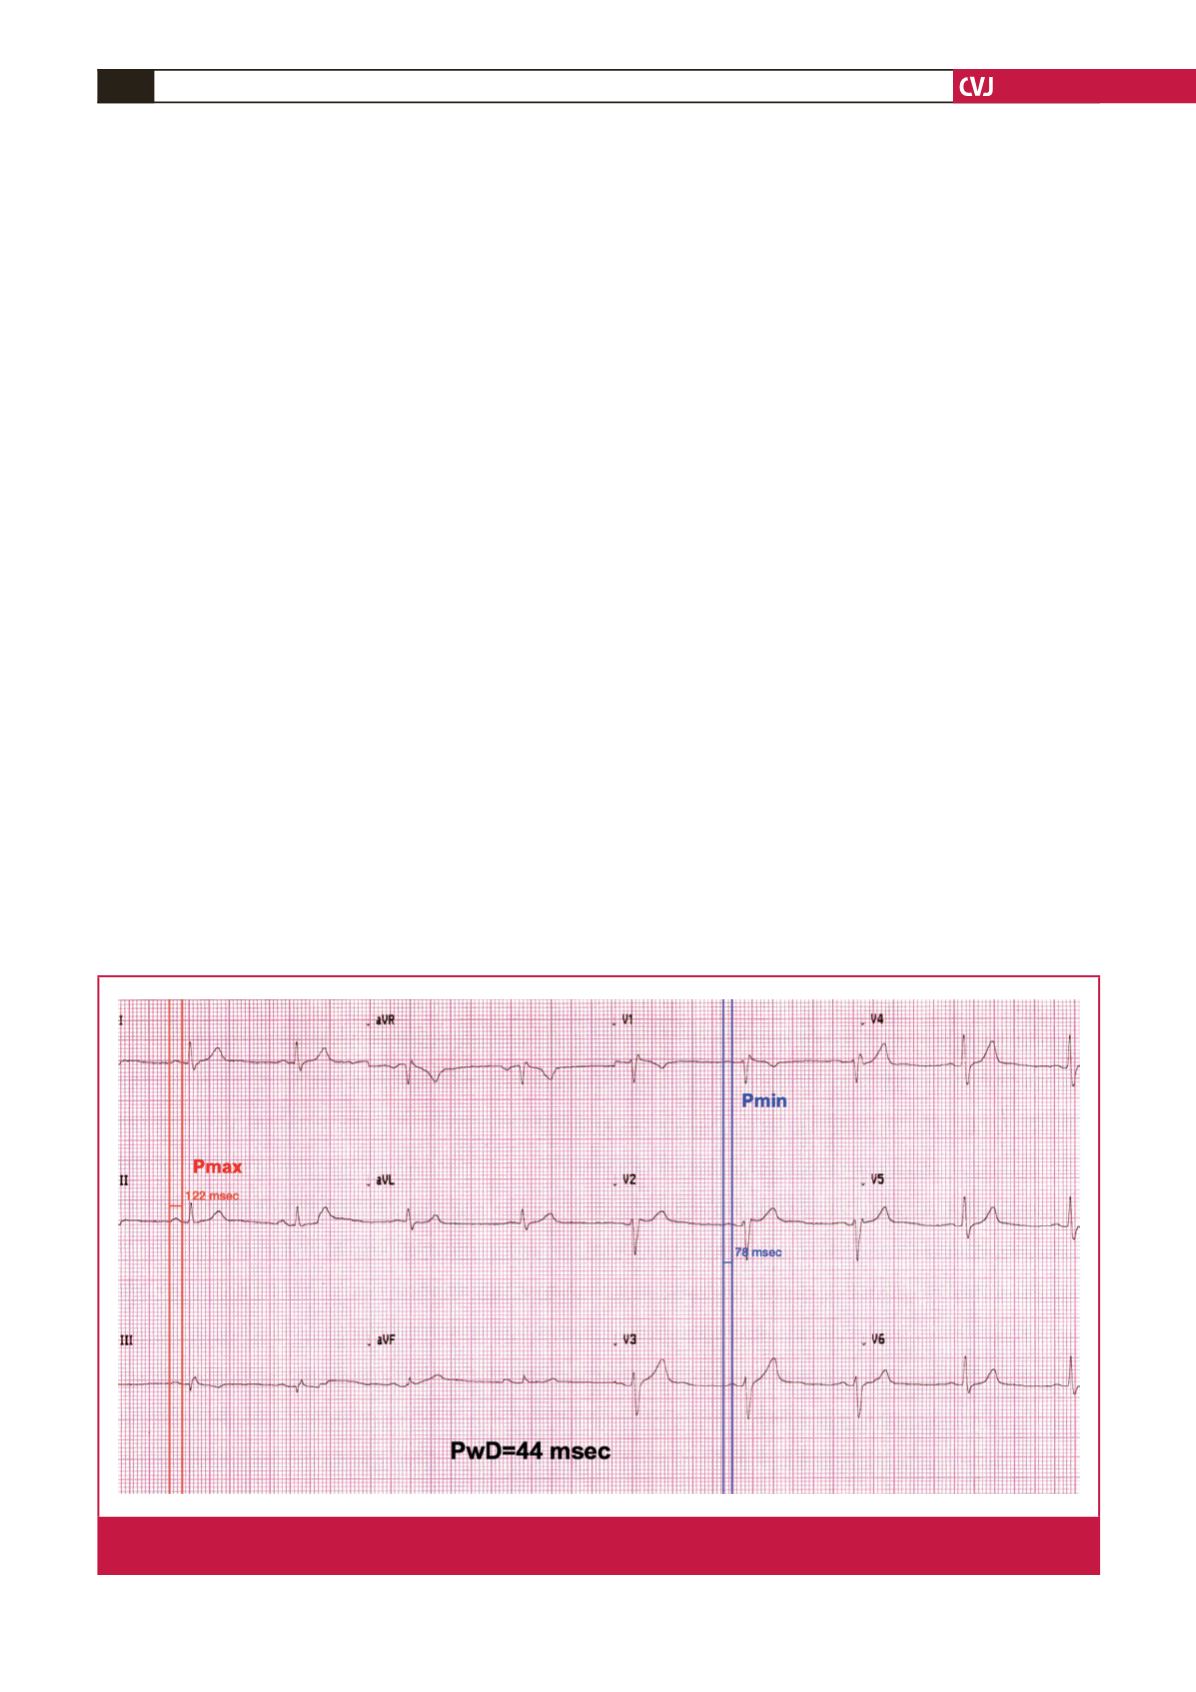
and the diagnosis of PAH. PwD was measured as the difference
between the maximum and minimum P-wave duration recorded
from multiple different surface ECG leads
6
(Fig. 1). The time in
milliseconds was measured on digitised 12-lead ECG recordings
using the on-screen digital caliper software Cardio Calipers
version 3.3 (Iconico, Inc, New York, NY). Results were taken as
the average of two readings. The patients’ ECGs were interpreted
by a cardiologist who was blinded to their clinical characteristics.
Transthoracic echocardiography (TTE) was performed
on a Vivid 7 (GE, Horten, Norway) system with transducer
frequencies appropriate to patient size. All quantitative measures
were performed by a cardiologist who was blinded to the clinical
characteristics of the patients. All measurements were done in
accordance with the current guidelines.
7,8
RV and right atrial
(RA) end-diastolic transverse dimension were recorded from the
apical four-chamber view. Systolic pulmonary artery pressure
was calculated from the tricuspid regurgitation Doppler using
the modified Bernoulli equation. Tricuspid annular-plane systolic
excursion (TAPSE) was measured using M-mode from the lateral
tricuspid annulus. All healthy individuals in the control group
underwent TTE for the same measurements as the patient group.
RHC, performed for all patients, was determined as
elevated systolic pulmonary artery pressure according to
echocardiography. All patients were diagnosed by right-sided
heart catheterisation according to standard criteria: mPAP
≥
25 mmHg and PVR
>
3 WU at rest in the presence of a normal
PCWP (
≤
15 mm Hg). Heart rate and systemic blood pressure
were measured just before RHC. RA, RV, pulmonary artery
and pulmonary capillary wedge pressures were measured via a
catheter passed through a sheath placed in the femoral vein.
Cardiac output (CO) was determined by the Fick method,
using oxygen consumption. Cardiac index (CI) was calculated
from the formula:
CI (l/min/m
2
)
=
CO (l/min)
__________________
body surface (m
2
)
PVR was calculated as:
PVR (WU)
=
mPAP (mmHg) – PCWP
____________________
CO (l/min)
All parameters were calculated as the mean value of three
different measurements, according to current recommendations.
9
After baseline haemodynamics were obtained, vasoreactivity was
assessed with either inhaled nitric oxide or iloprost.
Statistical analysis
The research data used to support the findings of this study
were supplied by the corresponding author under license and so
cannot be made freely available. Requests for access to these data
should be made to the corresponding author.
Continuous variables with parametric distribution are
expressed as mean
±
standard deviation. Categorical data are
expressed as frequencies and their differences were analysed
using the chi-squared test. Variables were investigated using
visual (histograms, probability plots) and analytical methods
Fig. 1.
PwD measurement in a sample ECG. DII derivation showing a maximum P-wave duration of 122 ms and VI derivation show-
ing a minimum P-wave duration of 78 ms. PwD was calculated as 44 ms.