


 25 / 68

CARDIOVASCULAR JOURNAL OF AFRICA • Volume 31, No 2, March/April 2020
AFRICA
77
(Kolmogorov–Smirnov/Shapiro–Wilk’s test) to determine
whether or not they were normally distributed. Parameters that
were normally distributed, and correlation coefficients and their
significance were calculated using the Pearson’s test.
A multiple linear regression model was used to identify
independent predictors of the 6MWD for the functional capacity
of PAH patients. A 5% type I error level was used to infer
statistical significance. Statistical analyses were performed using
SPSS version 20.0 (SPSS Inc, Chicago, Illinois, USA). Statistical
significance was taken as
p
<
0.05.
Results
A total of 33 patients were enrolled into the study. The baseline
clinical, haemodynamic, echocardiographic and ECG parameters
of patients are shown in Table 1. The mean age was 47.9
±
15.08
years, and the female gender was dominant with a rate of 78%.
Systolic PAP on echocardiography was 82
±
24.57 mmHg,
while mPAP determined by RHC, was 52.29
±
24.33 mmHg.
Maximum P-wave duration, calculated by surface ECG, was
112.129
±
36.03 ms, while minimum P-wave duration was 52.729
±
16.44 ms. Mean P-wave dispersion was 59.399
±
28.93 ms. TTE
measurements of the control group are also given in Table 1.
The correlations between PwD, mPAP calculated from RHC
and other haemodynamic and echocardiographic parameters
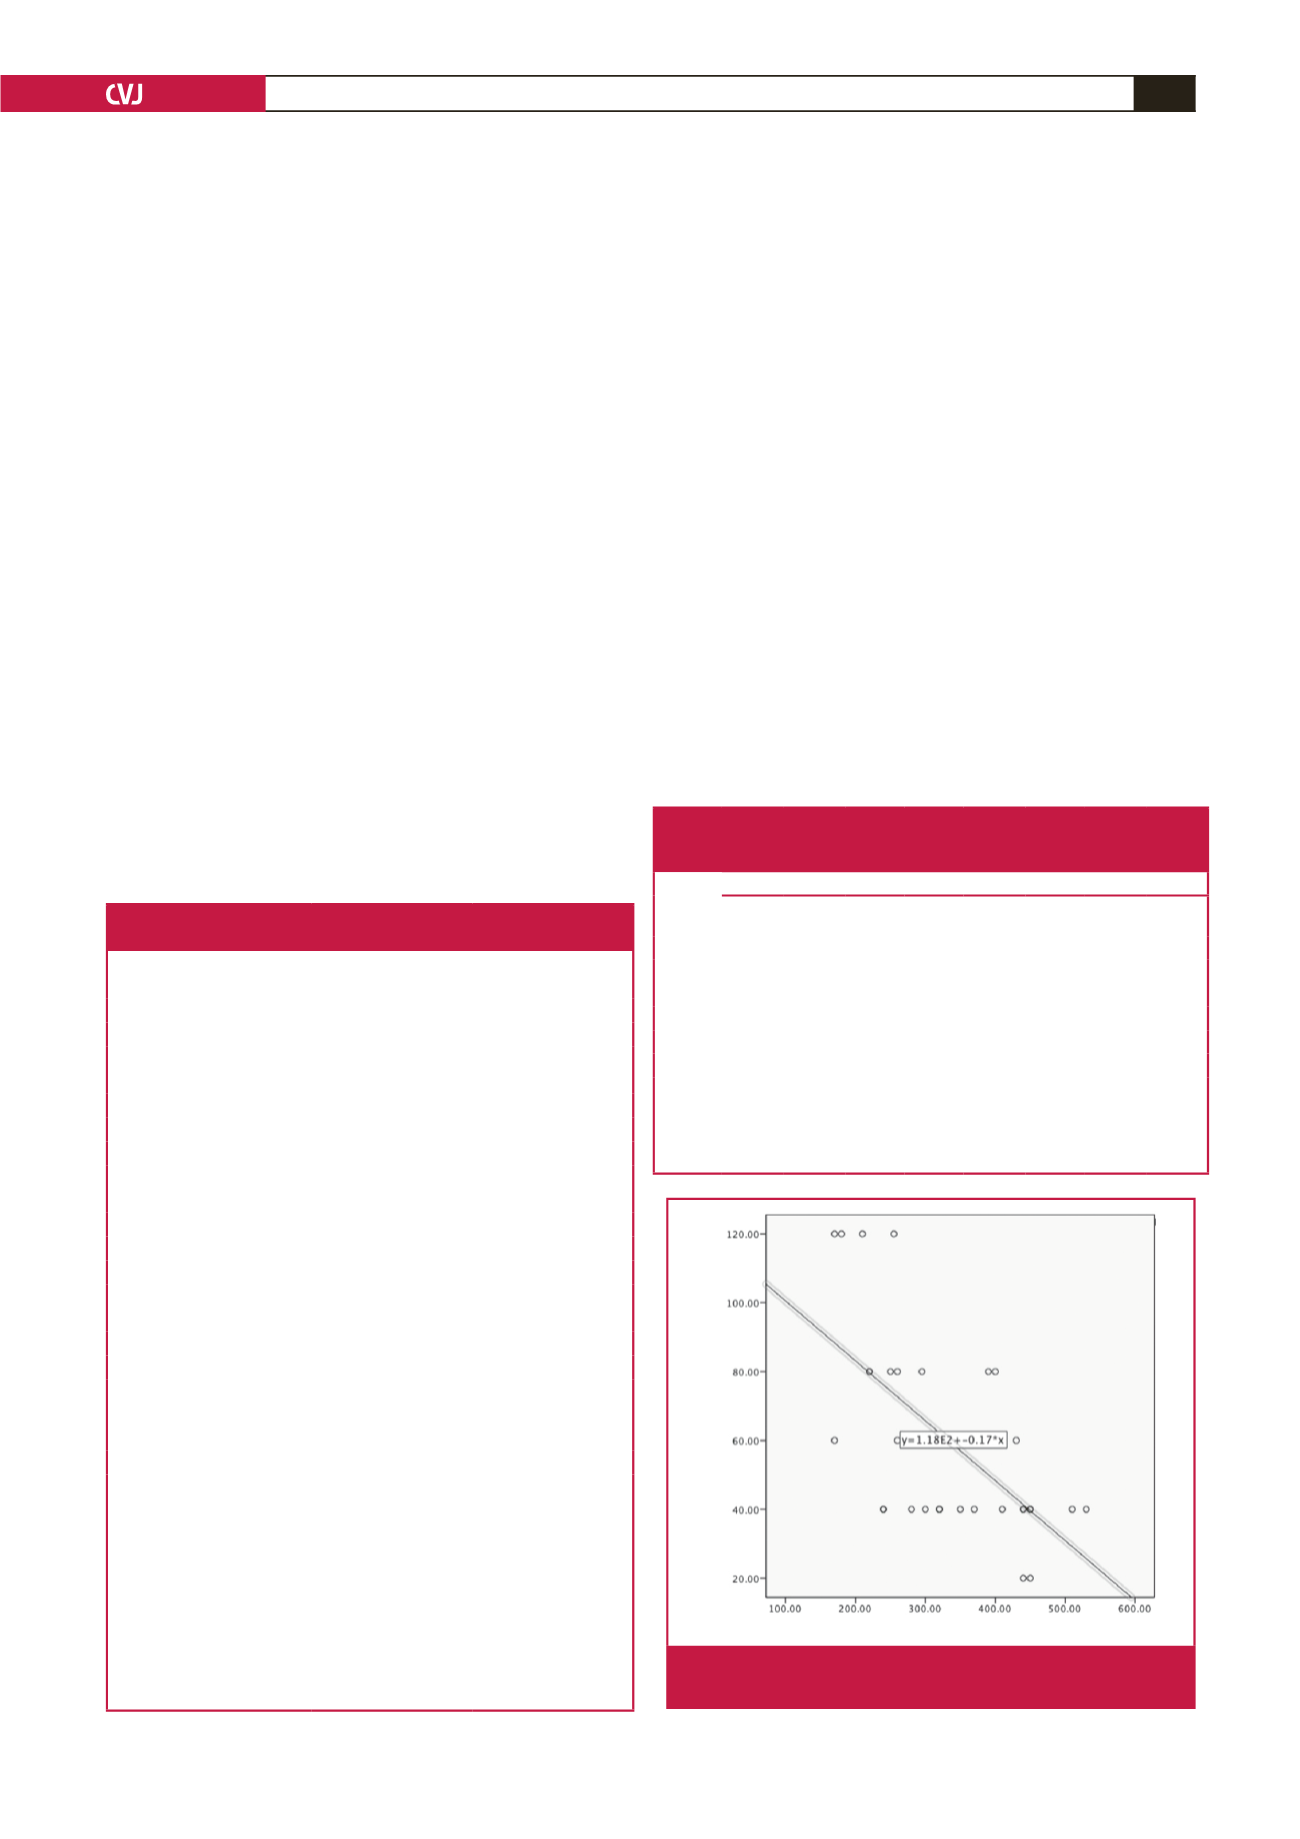
are shown in Table 2. There was a strong negative correlation
between PwD and 6MWD
(r
=
–0.63,
p
<
0.001)
(Table 2, Fig.
2), and also between mPAP calculated from RHC and 6MWD
(r
=
–0.79,
p
<
0.001) (Fig. 3). There was a positive correlation
between PwD and mPAP calculated from RHC
(r
=
0.34,
p
=
0.04) (Table 2).
In the multiple linear regression analysis, PwD and mPAP
determined by RHC were independently related to functional
capacity tested by 6MWD (Tables 3, 4). The multiple linear
regression analysis yielded a formula to predict 6MWD:
6MWD
=
578.2 (as a constant) – 1.37
×
PwD – 3.03
×
mPAP
by RHC
There was a significant correlation between PwD, RV size
and systolic PAP measured by echocardiography in the patient
population (
r
=
0.51,
p
<
0.01;
r
=
0.36,
p
=
0.04, respectively)
(Table 5). There was no correlation between PwD, TAPSE, and
RA and RV size in the control group (
r
=
–0.22,
p
=
0.22;
r
=
–0.09,
p
=
0.60;
r
=
–0.30,
p
=
0.09, respectively) (Table 6).
Discussion
To the best of our knowledge, this study is the first investigating
the relationship between PwD, functional capacity and
haemodynamic parameters in PAH. PwD and mPAP obtained
Table 1. Baseline demographic, haemodynamic, echocardiographic
and electrocardiographic parameters of the patients and control group
Variables
Min, Max
Mean
±
SD
Age (year)
24, 74
47.9
±
15.08
Cath meanPre (mmHg)
25, 109
52.21
±
24.33
Cath sysPre (mmHg)
39, 153
80.12
±
34.08
Cath diastPre (mmHg)
12, 67
30.75
±
15.49
6MWD (m)
170, 530
339.39
±
104.63
sPAP echo (mmHg)
45, 120
82
±
24.57
TAPSE (mm)
13, 21
16.06
±
1.93
ProBNP (pg/ml)
99, 3141
791.6
±
787.8
PVR (Wood)
4.3, 26.7
10.46
±
5.72
CI (l/min/m
2
)
1.7, 2.6
2.15
±
0.26
RA size (cm)
2.8, 5.4
4.78
±
5.37
RV size (cm)
2.6, 4.7
3.26
±
0.53
P
max
(ms)
80, 200
112.12
±
36.03
P
min
(ms)
40, 80
52.72
±
16.44
PwD (ms)
20, 120
59.39
±
28.93
P
max
(control) (ms)
60, 100
77.5
±
13.19
P
min
(control) (ms)
40, 80
52.5
±
17.41
PwD (control) (ms)
0, 40
25
±
12.44
RV size (control) (cm)
2.2, 2.8
2.46
±
0.16
RA size (control) (cm)
2.6, 3.3
2.96
±
0.18
TAPSE (control) (mm)
16, 23
18.87
±
1.8
Cath meanPre, mean catheter pressure of pulmonary artery; Cath sysPre,
systolic catheter pressure of pulmonary artery; Cath diastPre, diastolic cath-
eter pressure of pulmonary artery; 6MWD, six-minute walk distance; sPAP
echo, systolic pulmonary arterial pressure measured with echocardiography;
TAPSE, tricuspid annular-plane systolic excursion; ProBNP, N-terminal brain
natriuretic peptide; PVR, pulmonary vascular resistance; CI, cardiac index;
RA, right atrial; RV, right ventricular; P
max
, maximum P-wave duration; P
min
,
minimum P-wave duration; PwD, P-wave dispersion; P
max
(control), maximum
P-wave duration of the control group; P
min
control, minimum P-wave duration
of the control group; PwD (control), P-wave dispersion of the control group;
RV size (control), right ventricular size of the control group; RA size (control),
right atrial size of the control group; TAPSE (control), tricuspid annular-plane
systolic excursion of the control group.
Table 2. Correlations between the 6MWD, mean catheter pressure
of pulmonary artery, P-wave dispersion and other haemodynamic
and echocardiographic parameters
Correlations
Cath
meanPre TAPSE
Pro
BNP PVR RV size PwD 6MWD
sPAP
echo
Cath meanPre
r
1
–0.85 0.67 0.93 0.62 0.34 –0.79 0.85
p
<
0.001
<
0.001
<
0.001
<
0.001 0.04
<
0.001
<
0.001
6MWD
r
–0.79 0.68 –0.61 –0.63 –0.65 –0.63 1
–0.74
p
<
0.001
<
0.001
<
0.001
<
0.001
<
0.001
<
0.001
<
0.001
<
0.001
Cath meanPre, mean catheter pressure of pulmonary artery; 6MWD, six-minute
walk distance; TAPSE, tricuspid annular-plane systolic excursion; ProBNP,
N-terminal brain natriuretic peptide; PVR, pulmonary vascular resistance; RV, right
ventricular; PwD, P-wave dispersion; sPAP echo, systolic pulmonary arterial pres-
sure measured with echocardiography.
Six-minute walk distance (m)
PwD (msn)
R
2
linear = 0.398
Fig. 2.
Correlations between the six-minute walk distance and
P-wave dispersion in scatterplots.