


 33 / 66

CARDIOVASCULAR JOURNAL OF AFRICA • Volume 32, No 3, May/June 2021
AFRICA
143
potentiometric analyses (Beckman AU Chemistry Analyzer,
PathCare, SA).
14
Statistical analysis
Data are expressed as mean and standard error of the mean
(SEM) or as box plots and the mean, and
n
indicates the
number of replicates. Statistical analysis was conducted using
Statistica 13. Differences among multiple groups for data with
normal distribution (Kolmogorov–Smirnov and Shapiro–Wilk
normality tests) were evaluated using one-way analysis of
variance (ANOVA), followed by Tukey’s
post hoc
test. For
data without normal distribution, a Kruskal–Wallis test was
conducted, followed by Dunn’s
post hoc
test. A two-tailed
p
value
≤ 0.05 was considered statistically significant.
Results
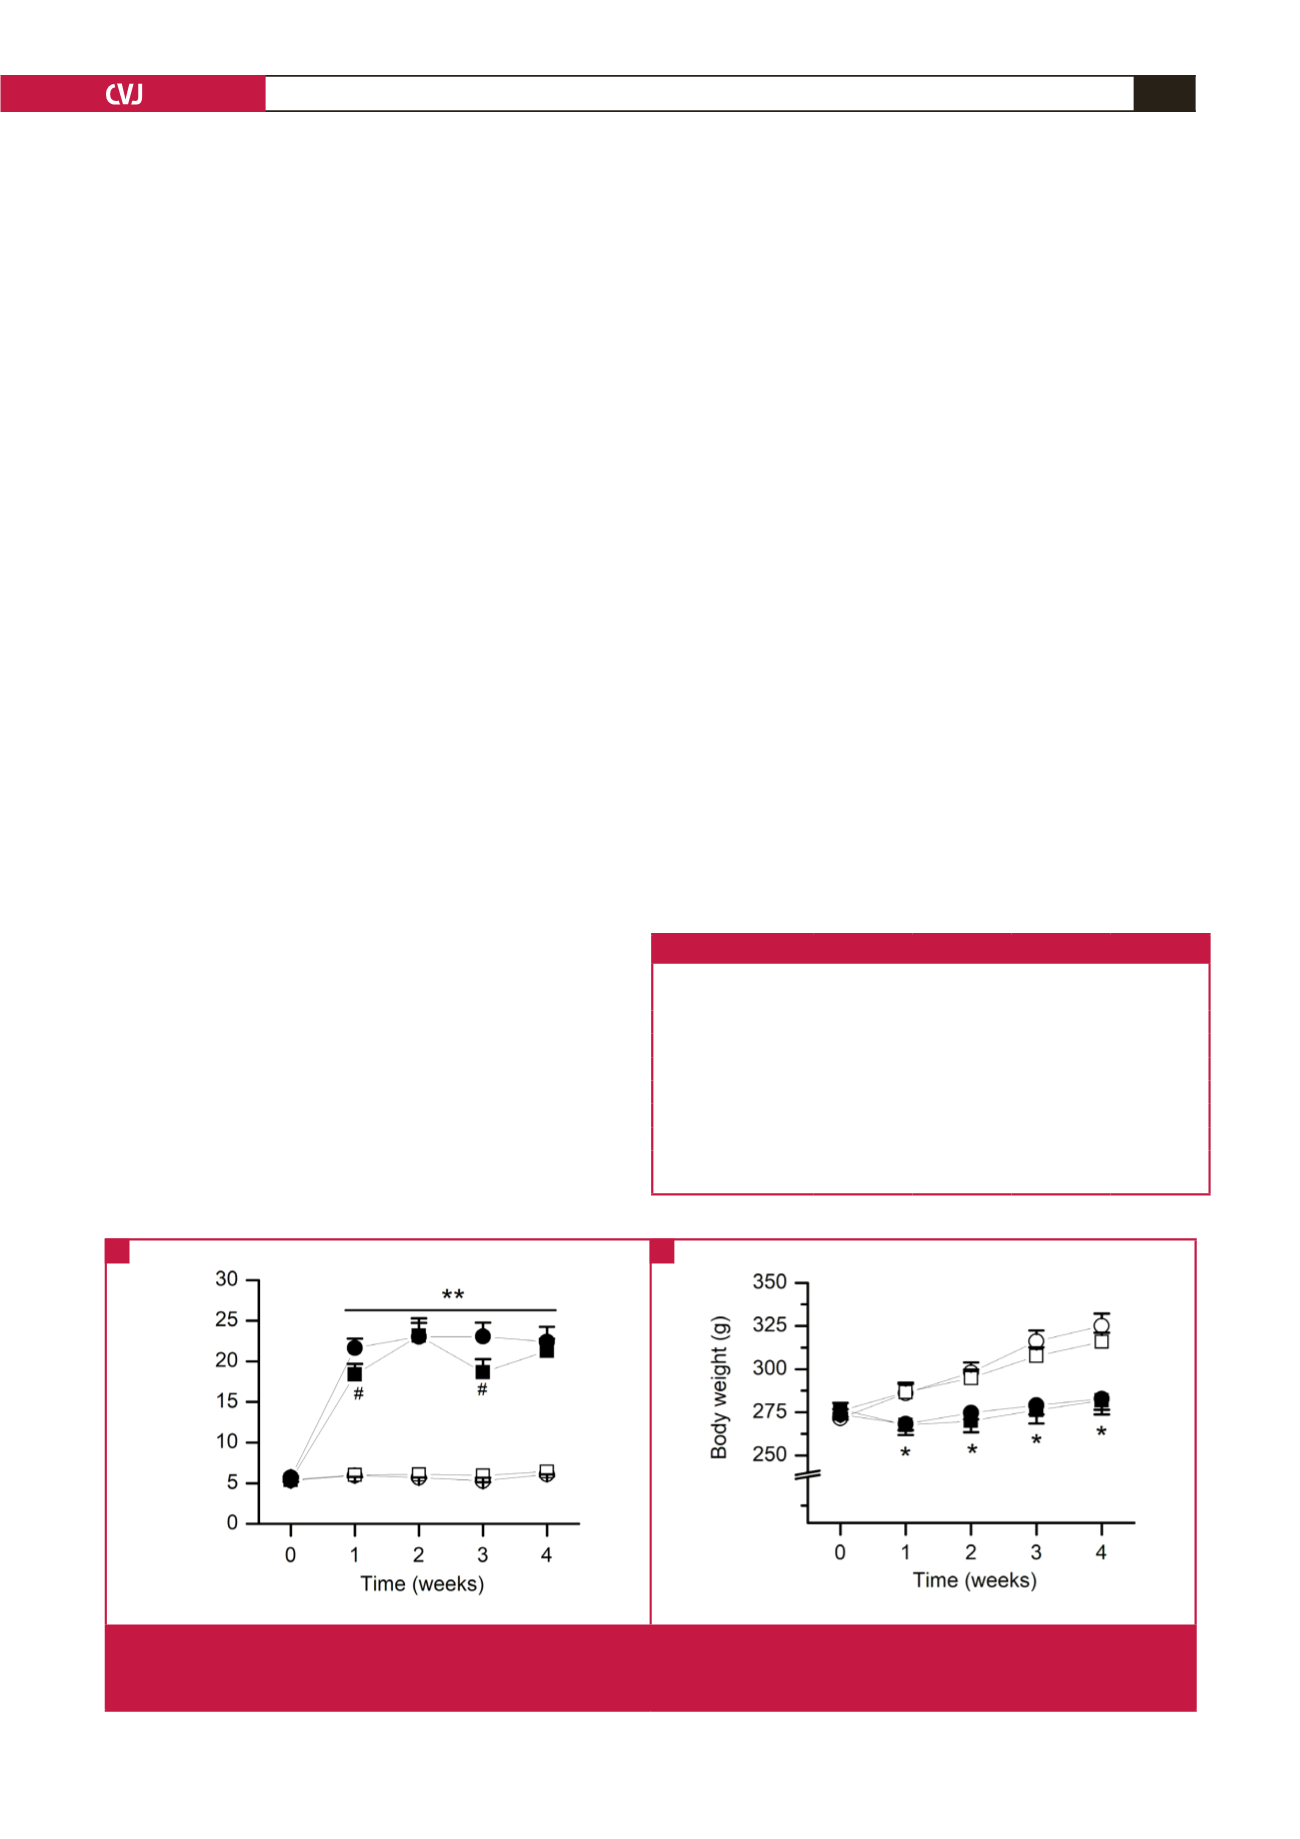
In vivo
treatment with STZ significantly increased the blood
glucose concentration and decreased the rat body weight (Fig.
1), starting from the first week after treatment (
p
< 0.05, STZ
vs control for each parameter). Overall, treatment with Mg
2+
did not prevent STZ-induced hyperglycaemia (
p
> 0.05, STZ
+ Mg
2+
vs STZ), except for the transient dips in blood glucose
concentration observed in the first and third weeks (Fig. 1A).
Mg
2+
also did not prevent the STZ-induced loss of body weight
(
p
> 0.05, STZ + Mg
2+
vs STZ; Fig. 1B). Mg
2+
treatment alone
had no significant effect on blood glucose concentration or on
body weight (
p
> 0.05, Mg
2+
vs control for each parameter).
STZ induced a significant decrease in the LVDP (
p
< 0.05,
STZ vs control), and this STZ-induced hypotensive effect was
prevented by Mg
2+
treatment (
p
= 0.03, STZ + Mg
2+
vs STZ;
Fig. 2A). Mg
2+
treatment on its own had no significant effect
on LVDP (
p
> 0.05, Mg
2+
vs control; Fig. 2A). STZ-treated
hearts also exhibited significant reductions in the indices of
LV contraction (+dP/dt
max
) and relaxation (–dP/dt
max
) as well
as in the overall contractility index (
p
< 0.05, STZ vs control
for each parameter; Fig. 2B–D). Among these changes, Mg
2+
treatment reversed the STZ-induced reduction of +dP/dt
max
and contractility index (
p
< 0.05, STZ + Mg
2+
vs STZ for each
parameter; Fig. 2B, C). Mg
2+
treatment alone had no detrimental
effect on +dP/dt
max
, –dP/dt
max
, or the contractility index (
p
> 0.05,
Mg
2+
vs control; Fig. 2B–D).
In addition, there were no significant differences in coronary
flow rate or in the ratio of heart weight to body weight among
the different treatment groups (Fig. 2E, F). There were also
no significant differences in the diastolic time constant of
ventricular relaxation (
tau
) among the groups (
tau
: 0.043 ± 0.065
s for control, 0.073 ± 0.030 s for STZ, 0.064 ± 0.023 s for STZ
+Mg
2+
, 0.080 ± 0.033 s for Mg
2+
; values are mean ± SEM,
p
>
0.05,
n
= 6 per group).
Representative ECG traces recorded on isolated hearts (Fig. 3)
showed typical apex-to-base electrical waveforms that resembled
lead II tracing on a surface ECG recording. Qualitatively, the
traces highlight a reduction in the heart rate of STZ-treated
hearts (Fig. 3B) compared to controls (Fig. 3A), but without
noticeable alterations of the ECG waveform patterns. Summary
data of ECG parameters (Table 1) show that STZ significantly
decreased the heart rate and prolonged the QT interval (
p
< 0.01
vs control for each parameter), and both these STZ effects could
be prevented by Mg
2+
treatment. Mg
2+
treatment alone had no
significant effect on heart rate or QT interval. There were no
significant differences in the R-, S- or T-wave amplitudes and
QRS and QTc intervals among the treatment groups.
Representative images of ventricular slices stained with either
H&E orMasson’s trichrome are shown in Fig. 4. TheH&E images
Table 1. Electrocardiogram parameters
Parameters
Control
STZ STZ+Mg
Mg
Heart rate (bpm)
233 ± 8
178 ± 14* 218 ± 8
#
234 ± 13
R-wave amplitude (mV) 5.22 ± 0.79 5.67 ± 1.31 6.24 ± 1.17 6.22 ± 0.85
S-wave amplitude (mV) 1.75 ± 0.27 2.13 ± 0.63 2.35 ± 0.73 0.40 ± 1.38
T-wave amplitude (mV) 2.12 ± 0.53 2.56 ± 0.67 2.73 ± 0.95 1.76 ± 0.46
QRS interval (s)
0.020 ± 0.003 0.024 ± 0.002 0.026 ± 0.006 0.024 ± 0.003
QT interval (s)
0.062 ± 0.002 0.079 ± 0.009* 0.065 ± 0.005
#
0.064 ± 0.006
QTc (s)
0.124 ± 0.006 0.137 ± 0.016 0.119 ± 0.007 0.121 ± 0.009
QTc represents QT interval corrected for heart rate. Values are mean ± standard
error of the mean;
n
= 7–11 per group; *
p
< 0.05 vs control;
#
p
< 0.05 vs STZ.
Fig. 1.
General parameters. A: Random blood glucose concentration. B: Rat body weight. The parameters were measured weekly in
different treatment groups of rats [
○
, control;
●
, streptozotocin (STZ);
■
, STZ + Mg
2+
;
□
, Mg
2+
]. Values are mean ± standard
error of the mean;
n
= 12–15 per group; *
p
< 0.05, **
p
< 0.01 versus control;
#
p
< 0.05 versus STZ.
A
B
Blood glucose (mmol/l)