


 34 / 66

CARDIOVASCULAR JOURNAL OF AFRICA • Volume 32, No 3, May/June 2021
144
AFRICA
showed normal cardiomyocyte structural outlines, separated
by extracellular spaces that were relatively free of cellular
components or other infiltrates (Fig. 4A). There were also no
apparent distortions in the arrangement of the myofibrils. There
were no significant differences in cardiomyocyte width among
the treatment groups (
p
> 0.05; Fig. 4C). The Masson’s trichrome
images showed no differences in the interstitial or perivascular
fibrosis score among the treatment groups (Fig. 4B, D).
To explore the role of cardiac metabolic stress, Western blot
analysis was performed for the mitochondrial ATP synthase
(ATP5A), a key component of the mitochondrial respiratory
function. Representative images on Western blot films (Fig. 5A)
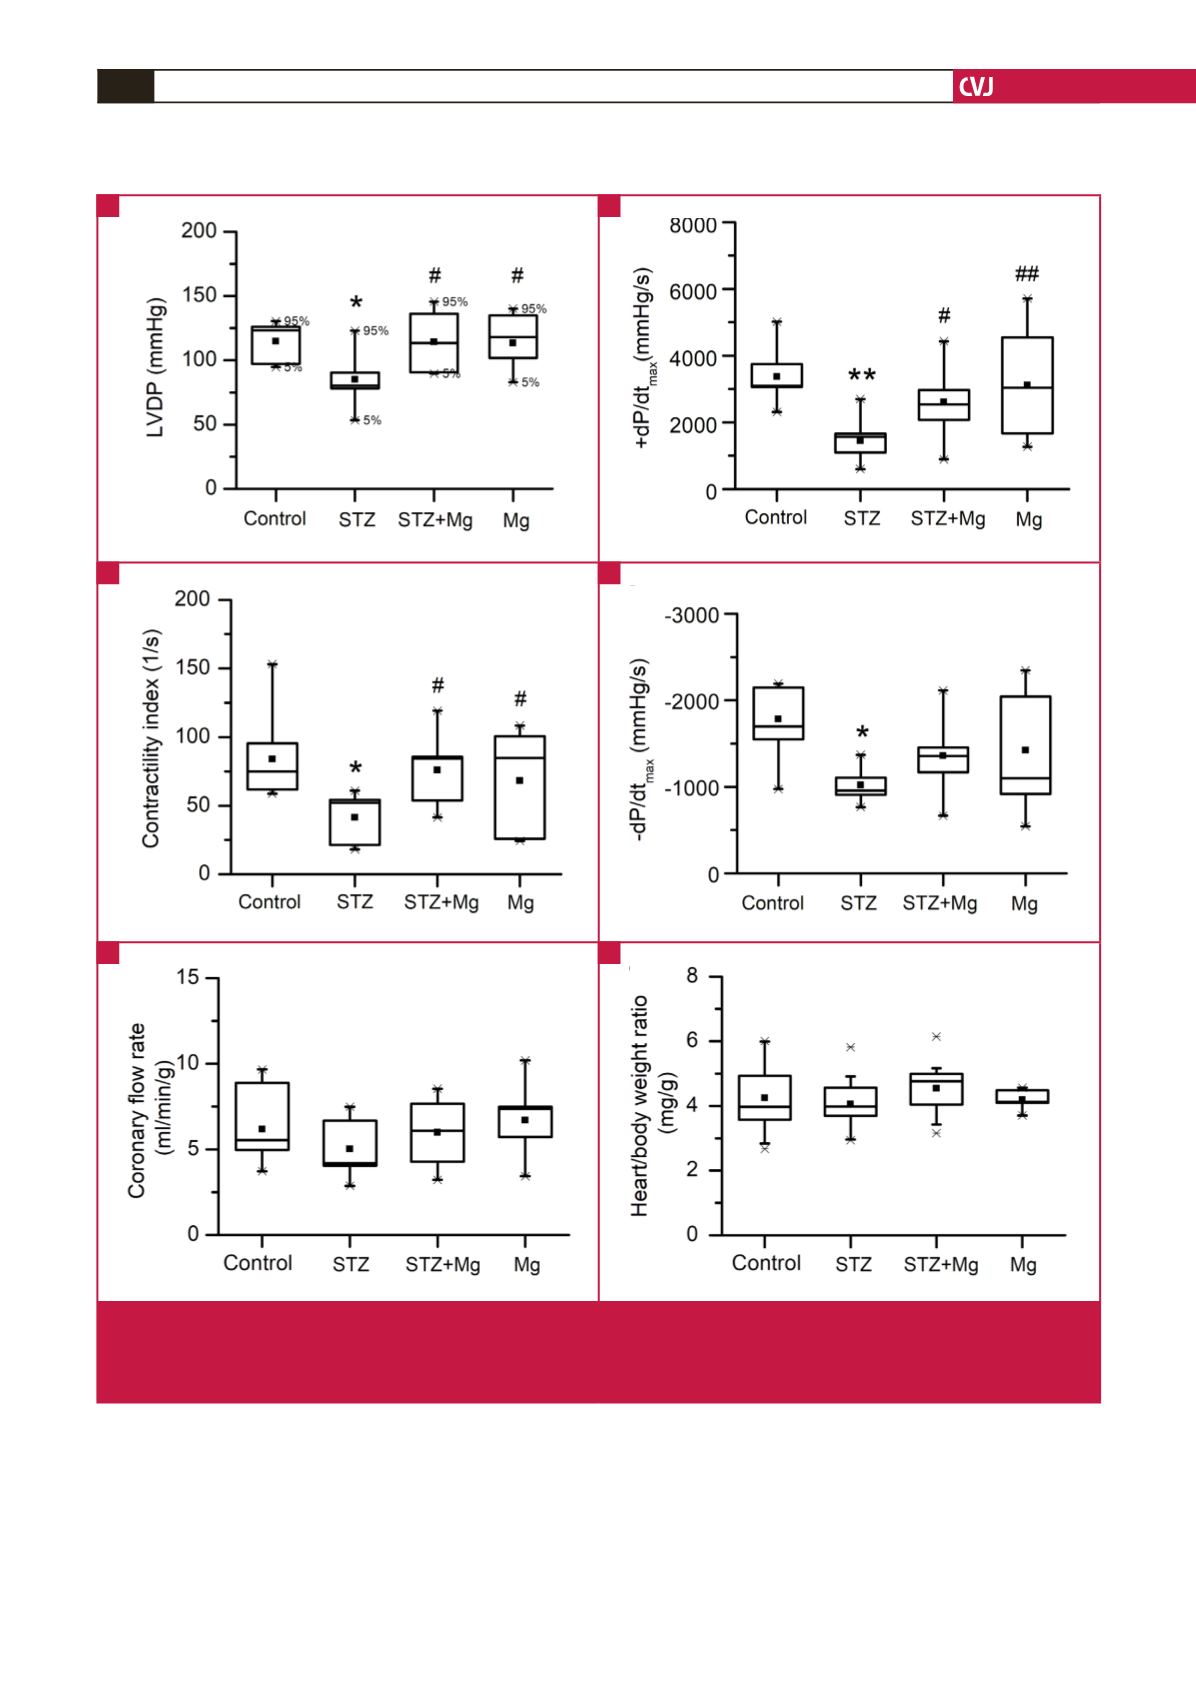
Fig. 2.
Effects of treatments on haemodynamic parameters. A: Left ventricular (LV) developed pressure (LVDP). B: Maximal rate of
LV pressure increase (+dP/dt
max
). C: Contractility index. D: Maximal rate of LV pressure decline (–dP/dt
max
). E: Coronary flow
rate, normalised to heart weight. F: Heart weight to body weight ratio. Data are shown as box plots and the mean (
■
);
n
=
6–9 per group; *
p
< 0.05, **
p
< 0.01 versus control;
#
p
< 0.05,
##
p
< 0.01 versus STZ.
A
C
E
B
D
F