


 36 / 66

CARDIOVASCULAR JOURNAL OF AFRICA • Volume 32, No 3, May/June 2021
146
AFRICA
Fig. 4
b
c
d
Haematoxylin & eosin stain
a
Masson’s trichrome stain
Control
STZ
STZ+Mg
Mg
Control
20 µm
STZ
20 µm
STZ+Mg
20 µm
Mg
20 µm
Fig. 4
b
c
d
Haematoxylin & eosin stain
Mass n’s trichrome stain
Control
STZ
STZ+Mg
Mg
Control
20 µm
STZ
20 µm
STZ+Mg
20 µm
Mg
20 µm
Fig. 4
b
c
d
Haematoxylin & eosin stain
a
Masson’s trichrome stain
Control
STZ
STZ+Mg
Mg
Control
20 µm
STZ
20 µm
STZ+Mg
20 µm
g
20 µm
Fig. 4
c
Hae atoxylin & eosin stain
a
a son’s trichro e stain
Control
STZ
STZ+ g
g
Control
20 µ
STZ
20 µ
STZ+ g
20 µ
Mg
20 µ
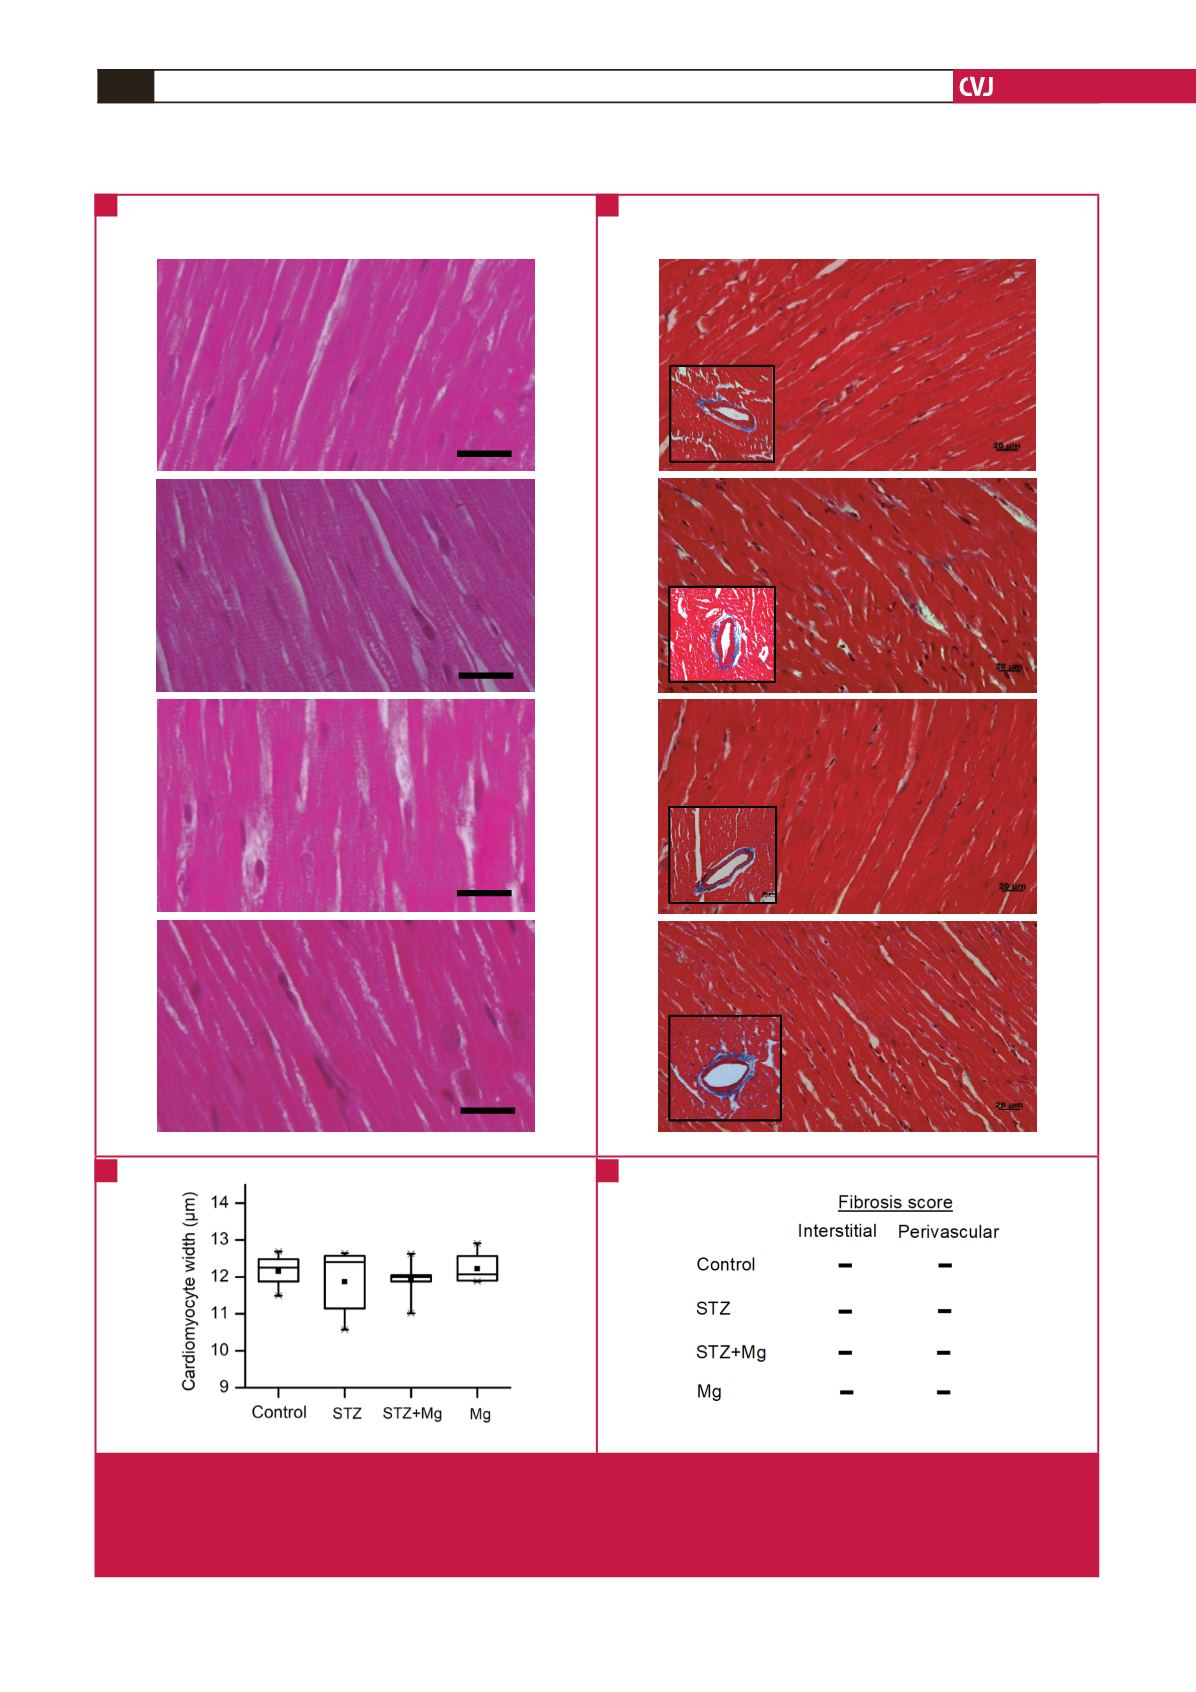
Fig. 4.
Histological analyses of ventricular tissue. A: Representative images of different ventricular tissue sections stained with
haematoxylin and eosin (H&E). Scale bar = 20 µm (× 40 magnification). B: Representative images of different ventricular
tissue sections stained with Masson’s trichrome. Insets: Images of perivascular tissue. Scale bar = 20 µm (× 40 magnifica-
tion). C: Summary data of ventricular cardiomyocyte width. D: Arbitrary score of the degree of interstitial and perivascular
fibrosis: –, none; +, mild. Data are shown as box plots and the mean (
■
);
n
= 6 per group.
A
C
B
D
t
lin and eosin stain