


 48 / 66

CARDIOVASCULAR JOURNAL OF AFRICA • Volume 32, No 3, May/June 2021
158
AFRICA
stroke (Table 2). All the estimates were self-reported conditions.
The total sample size of the studies that were included was
75 140 (41 168 for CHD and 33 972 for stroke).
Only a pooled estimate for prevalence was calculated, since
there were insufficient studies found that reported incidence
rates. The pooled overall prevalence for stroke was 1.29% (95%
CI = 0.83; 1.75,
I
2
= 97.2%,
p
-value = 0.000), and for CHD it was
4.29% (95% CI = 3.13; 5.45,
I
2
= 95.8%,
p
-value = 0.000). The
I
2
statistic showed high between-study heterogeneity, greater than
90% for both CHD and stroke (Figs 2, 3).
As a sensitivity analysis, outlying studies were excluded to
assess whether the effect estimate was greatly influenced (Table
3). For stroke, Phaswana-Mufaya
et al
.
26
and Shisana
et al
.
27
were individually removed, and then both were removed at the
same time. The overall effect estimate was reduced from 1.29
to 0.92 when Phaswana-Mufaya
et al
. was excluded, and went
down slightly to 1.20 when Shisana
et al
. was excluded. The
heterogeneity was smallest (
I
2
= 90.7%), although still quite large,
when both studies were removed and therefore had the most
profound influence on the overall prevalence effect estimate.
Identification
Screening
Eligibility
Included
Records identified
through database
searching
(
n
= 2 959)
Additional records
Identified through
other sources
(
n
= 20)
Records after duplicates removed
(
n
= 2 466)
Records screened
(
n
= 2 466)
Records excluded
(
n
= 2343)
Full-text articles
assessed for
eligibility
(
n
= 123)
Full-text articles
excluded, with
reasons (
n
= 111)
Studies did not
report incidence or
prevalence of stroke/
CHD
Full-text articles not
found
Studies included
only populations that
had stroke/CHD
Studies included
in quantitative
synthesis
(meta-analysis)
(
n
= 12)
Fig. 1.
Study-selection process using the PRISMA flow
diagram.
Table 2. Final CHD and stroke studies included in the meta-analysis
Author, year
Study period
Case definition
Coronary heart disease
South African Demographic
Health Survey, 1998
24
1998
Self-reported CHD
South African Demographic
Health Survey, 2003
25
2003
Self-reported CHD
Phaswana-Mafuya
et al
., 2013
26
2008
Self-reported angina
Shisana
et al
., 2014
27
2012 Self-reported heart disease (heart
attack, angina or chest pain)
Arokiasamy
et al
., 2016
28
2007–2010
Self-reported angina
Stroke
South African Demographic
Health Survey, 1998
24
1998
Self-reported stroke
Phaswana-Mafuya
et al
., 2013
26
2008
Self-reported stroke
Shisana
et al
., 2014
27
2012
Self-reported stroke
Wandai and Day, 2015
29
2008
Self-reported stroke
Wandai and Day, 2015
29
2010
Self-reported stroke
Wandai and Day, 2015
29
2012
Self-reported stroke
Wandai and Day, 2015
29
2013
Self-reported stroke
Table 3. Sensitivity analysis with outlying studies
and those with gender breakdowns excluded
Condition Meta-analysis
Number
of studies
Esti-
mate 95% CI
Higgins
I
2
(%)
Without outlying studies
CHD All studies
5
4.29 3.13 5.45 95.8
Excluding Shisana
et al
.
26
4
4.75 4.25 5.25 65.6
Stroke All studies
7
1.29 0.83 1.75 97.2
Excluding Phaswana-Mufa-
ya
et al
.
26
6
0.92 0.58 1.26 95.0
Excluding Shisana
et al
.
27
6
1.20 0.74 1.65 96.9
Excluding both
5
0.75 0.49 1.01 90.7
Without those with gender breakdowns
CHD All studies
5
4.29 3.13 5.45 95.8
Excluding Arokiasamy
et al
.;
29
SADHS;
24
Shisana
et al
.
27
2
4.63 3.61 5.66 82.1
Stroke All studies
7
1.29 0.83 1.75 97.2
Excluding SADHS;
24
Shisa-
na
et al
.
27
5
1.26 0.70 1.83 97.3
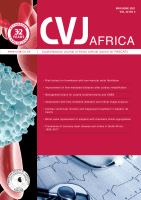
Study authors
SADHS, 1998
4.80 (4.45,5.17)
4.15 (3.70, 4.60)
5.20 (4.99,6.48)
2.20 (1.80,2.70)
5.30 (4.20, 6.50)
4.29 (3.13, 5,45)
5
0
Effect (95% Cl)
(%)
Weight
21.02
20.78
19.70
20.78
17.72
100.00
SADHS, 2003
Phaswana-Mafuya
et al
., 2013
Shisana
et al
., 2014
Arokiasamy
et al
., 2016
Overall (
I
2
= 95.8%)
Weights are from random-effects model.
SADHS, South Africa Demographic Health Survey.
Fig. 2.
Pooled prevalence rates of CHD.
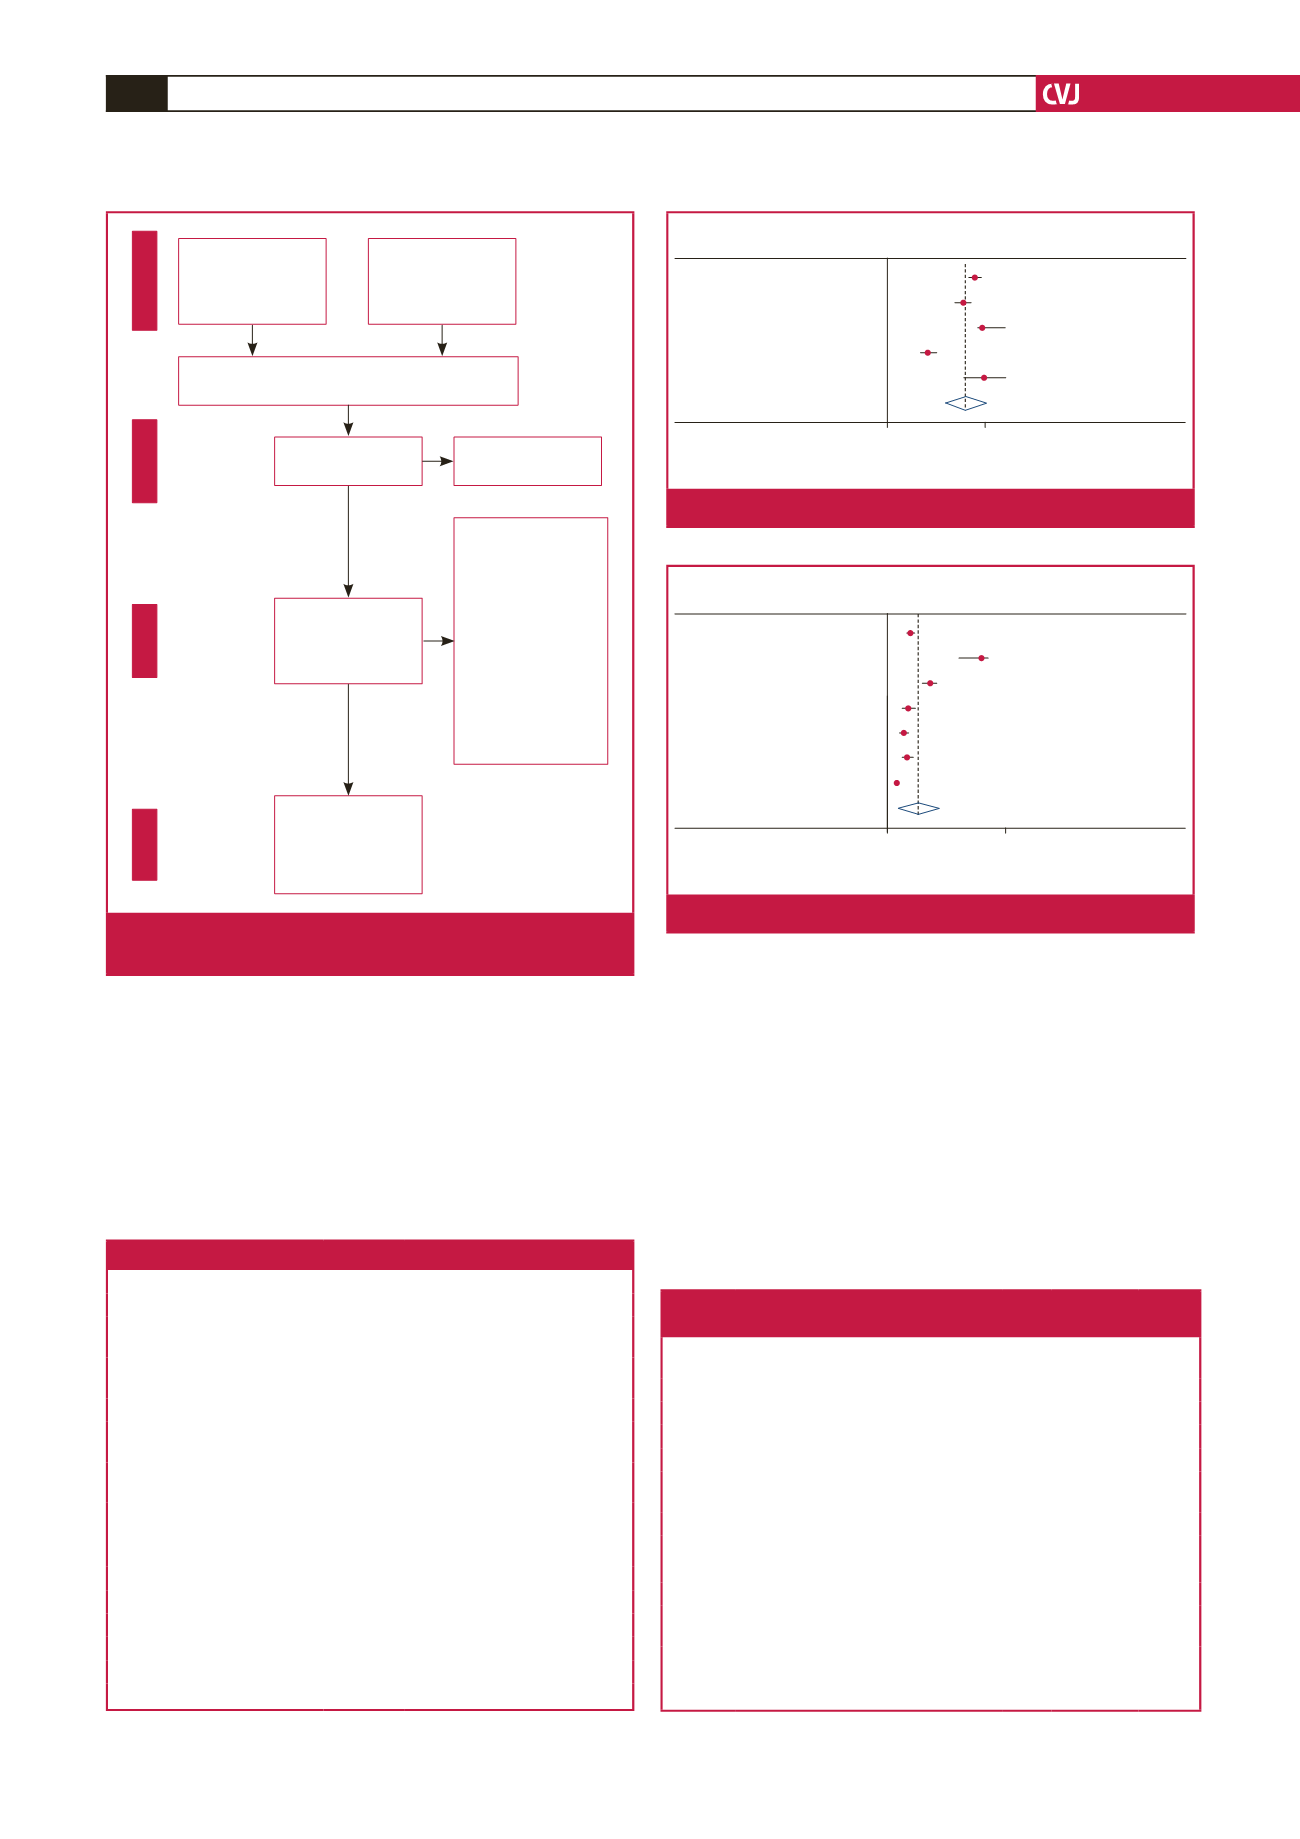
Study authors
SADHS, 1998
0.98 (0.83, 1.16)
4.00 (3.05, 4.26)
1.80 (1.50, 2.10)
0.90 (0.60, 1.20)
0.80 (0.70, 1.10)
0.70 (0.50, 0.90)
0.40 (0.30, 0.50)
1.29 (0.83, 1.75)
0
Effect (95% Cl)
(%)
Weight
14.88
12.02
14.26
14.26
14.76
14.76
15.07
100.00
Phaswana-Mafuya
et al
.,2013
Shisana
et al
., 2014
Wandai and Day, 2015
Wandai and Day, 2015
Wandai and Day, 2015
Wandai and Day, 2015
Overall (
I
2
= 95.8%)
Weights are from random-effects model.
SADHS, South Africa Demographic Health Survey.
5
Fig. 3.
Pooled prevalence rates of stroke.