


 21 / 88

CARDIOVASCULAR JOURNAL OF AFRICA • Volume 28, No 4, July/August 2017
AFRICA
223
were detailed. These were described as either intra- or extra-
pulmonary findings.
The CT features of TB, when present, were documented.
Scan limitations were recorded as either of ‘diagnostic quality’,
‘suboptimal but readable’, or ‘suboptimal and not reliable’.
Lastly, additional information was collected from the laboratory,
patient notes and request forms and these included: CD4 count*,
viral load*, microbiological diagnosis of tuberculosis (sputum,
lymph-node histology, pleural fluid analysis)*, and highly active
anti-retroviral therapy (HAART) commencement date and drug
regimen. *Only results from the NHLS database within six
months of the CTPA scan having been performed were recorded.
Statistical analysis
Data were analysed with the aid of statisticians using the
following software tools and packages: Stata MP data analysis
and statistical software (versions 11 and 13) provided by
StataCorp LP, Texas, USA; IBM SPSS Statistics (version 22,
64-bit edition, IBM Corporation), USA; R (version 3.1.3, 64-bit
version, the R Foundation for Statistical Computing); and GNU
project free software with worldwide contributors.
Frequencies and percentages were recorded for the presence
of all findings. The descriptive data such as the distribution and
extent of PE (according to the lobar arterial anatomy of the
lung) were reproduced in the form of frequency tables. Qanadli
scores were reported as percentages (derived from the degree of
occlusion as per the segmental and lobar arterial anatomy of
the lung).
Fishers exact test of association was used to compare the
differences in severity of PE between the HIV-positive and
-negative groups. Comparison was made between HIV-positive/
HIV-negative, PE-absent/PE-present, and TB-absent/TB-present
groups, by producing contingency tables of counts and using the
Chi-squared test/Fishers exact tests of association. The analysis
included only TB results that were available within six months of
the scan being performed. The Mann–Whitney
U
-test was used
to test for a difference in the distribution of the cardiovascular
parameters by HIV status.
Results
There were 164 patients; 115 (70.1%) females and 49 (29.9%)
males (age range 21–87 years, mean 45) (Fig. 3) in the study
made up of 49% HIV-infected patients, 23% uninfected and
27% patients whose HIV status was unknown (Table 1). The
frequency/prevalence of pulmonary embolism in the sample was
43 out of a total of 164 patients (26%; 95% CI: 19.67–33.65%).
HIV positivity in our CTPA population for suspected PE was
68% (Table 2). The prevalence of HIV in patients with proven PE
was 67% (95% CI: 48.17–82.04%,
p
=
1.000) (Table 2).
Only 76 of the total sample of 164 patients had a
microbiologically confirmed TB result. The prevalence of TB
in those who underwent TB testing was 40% (95% CI: 28.44–
51.35%) (Table 3).
The prevalence of TB in the PE-positive group was 57% (95%
CI: 34.49–76.81%) while the prevalence of TB in the PE-negative
group was 32% (95% CI: 19.92–46.32%) (Table 3). The Fisher’s
exact test showed a statistically significant association between
PE and TB status (
p
=
0.073) at the 10% level. Only 19 patients
of the sample of 33 patients with HIV testing and proven PE had
a microbiologically confirmed TB result (Table 4).
The prevalence of TB in the HIV-positive patients with PE
was 71% (95% CI: 41.90–91.61%) while the prevalence of TB
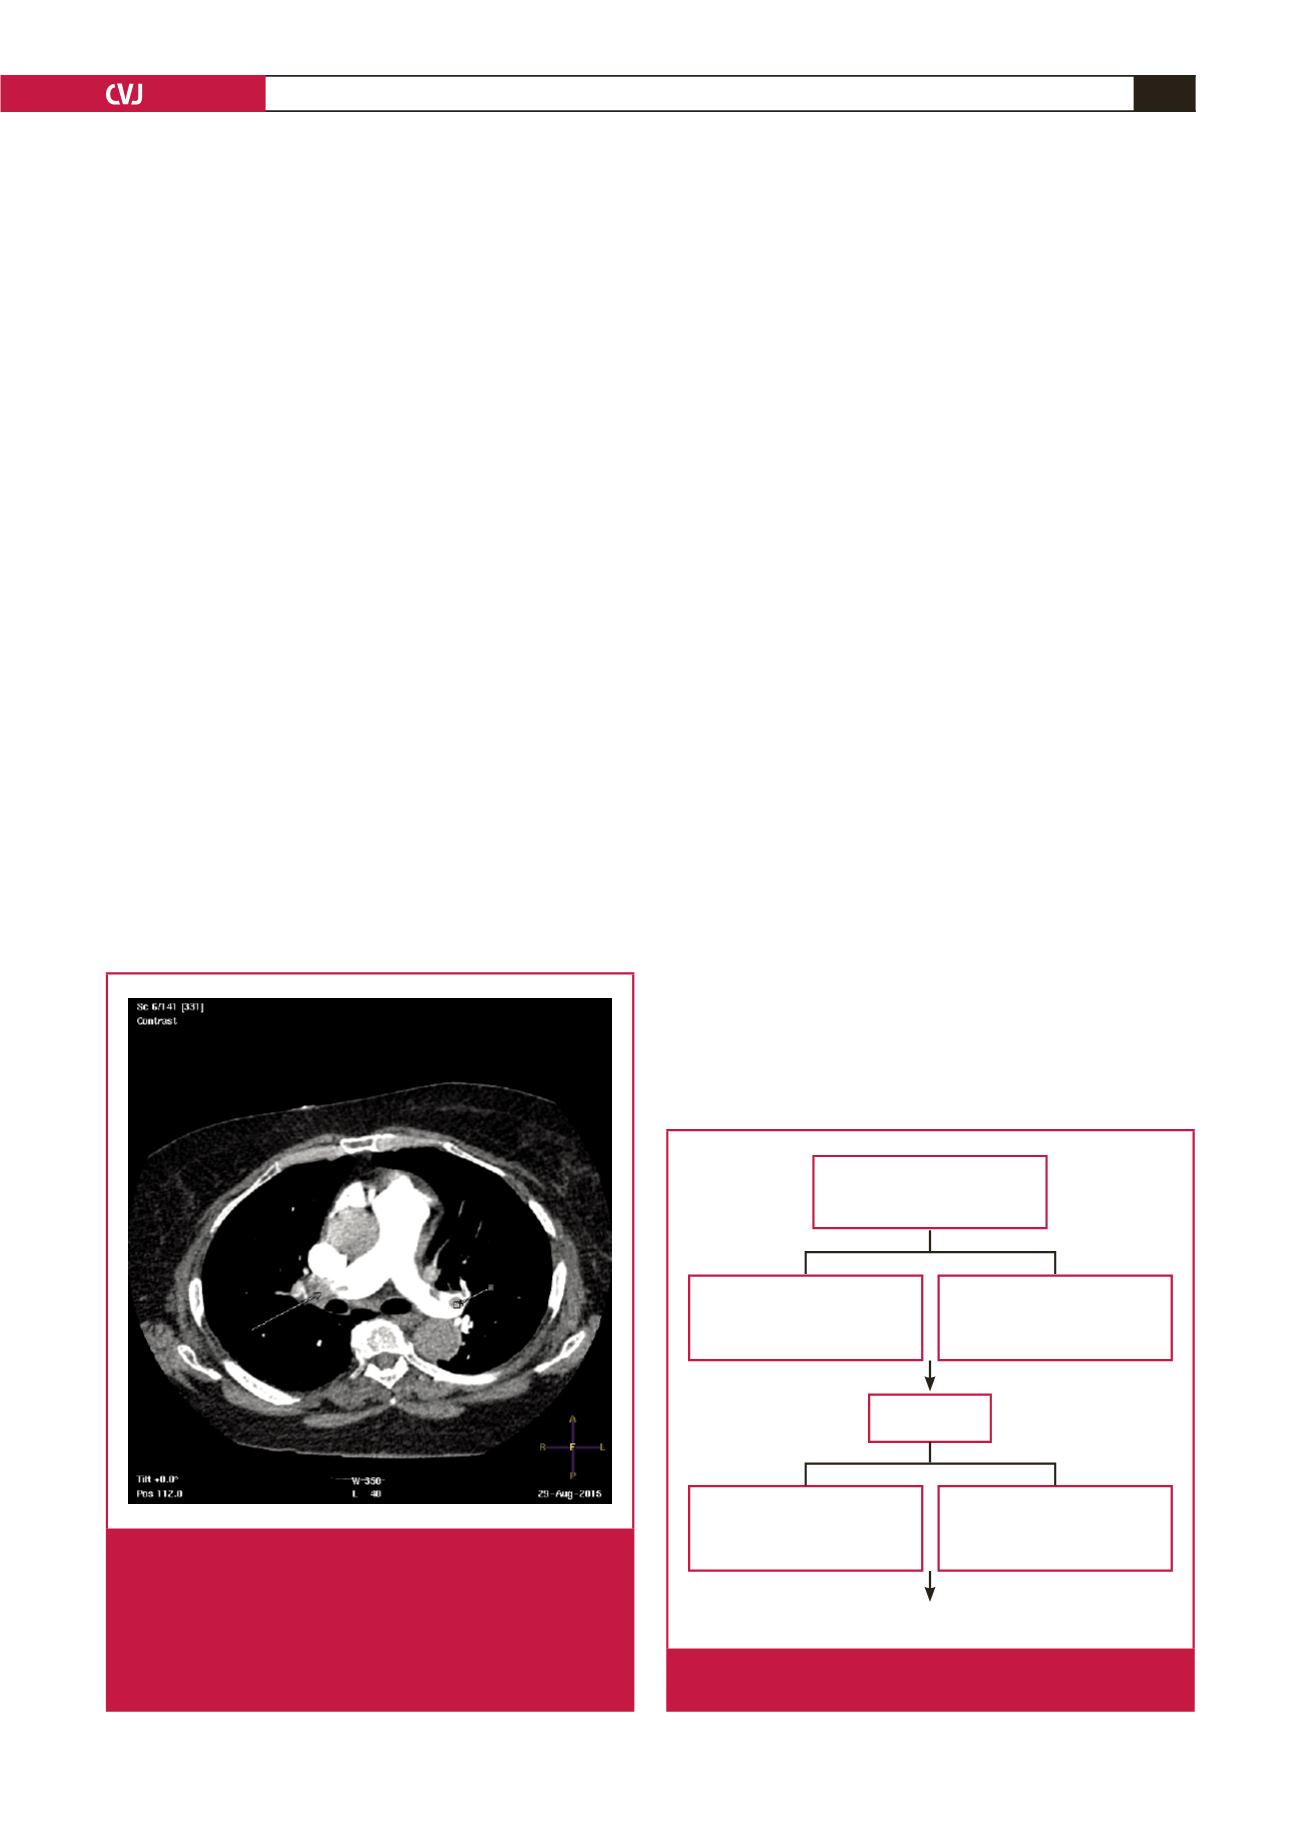
Fig. 2.
Example of calculation of the Qanadli obstruction
index from CTPA. Axial CT scan shows a proximal
completely occlusive thrombus (long arrow) in the
right main pulmonary artery, and partial thrombus
in the left main pulmonary artery (short arrow). The
Qanadli score index would therefore be [(10
×
2) + (10
×
1)
=
30/40]
=
75%.
Excluded due to no request
form or no folder retrievable
92
1
Repeat scan during the
collection period
Excluded due to lack of
clinical information or
different imaging performed
7
3
Scans could not be accessed
for image interpretation due
to inability to open the files
Total scans included for
review
267
168
Final sample size = 164
Fig. 3.
Flow chart showing the final sample size after exclu-
sion criteria were applied.