


 23 / 88

CARDIOVASCULAR JOURNAL OF AFRICA • Volume 28, No 4, July/August 2017
AFRICA
225
identified PE is presented in Table 8. Fisher’s exact test showed
no significant association between HIV status of the patient and
the presence of each of the complications.
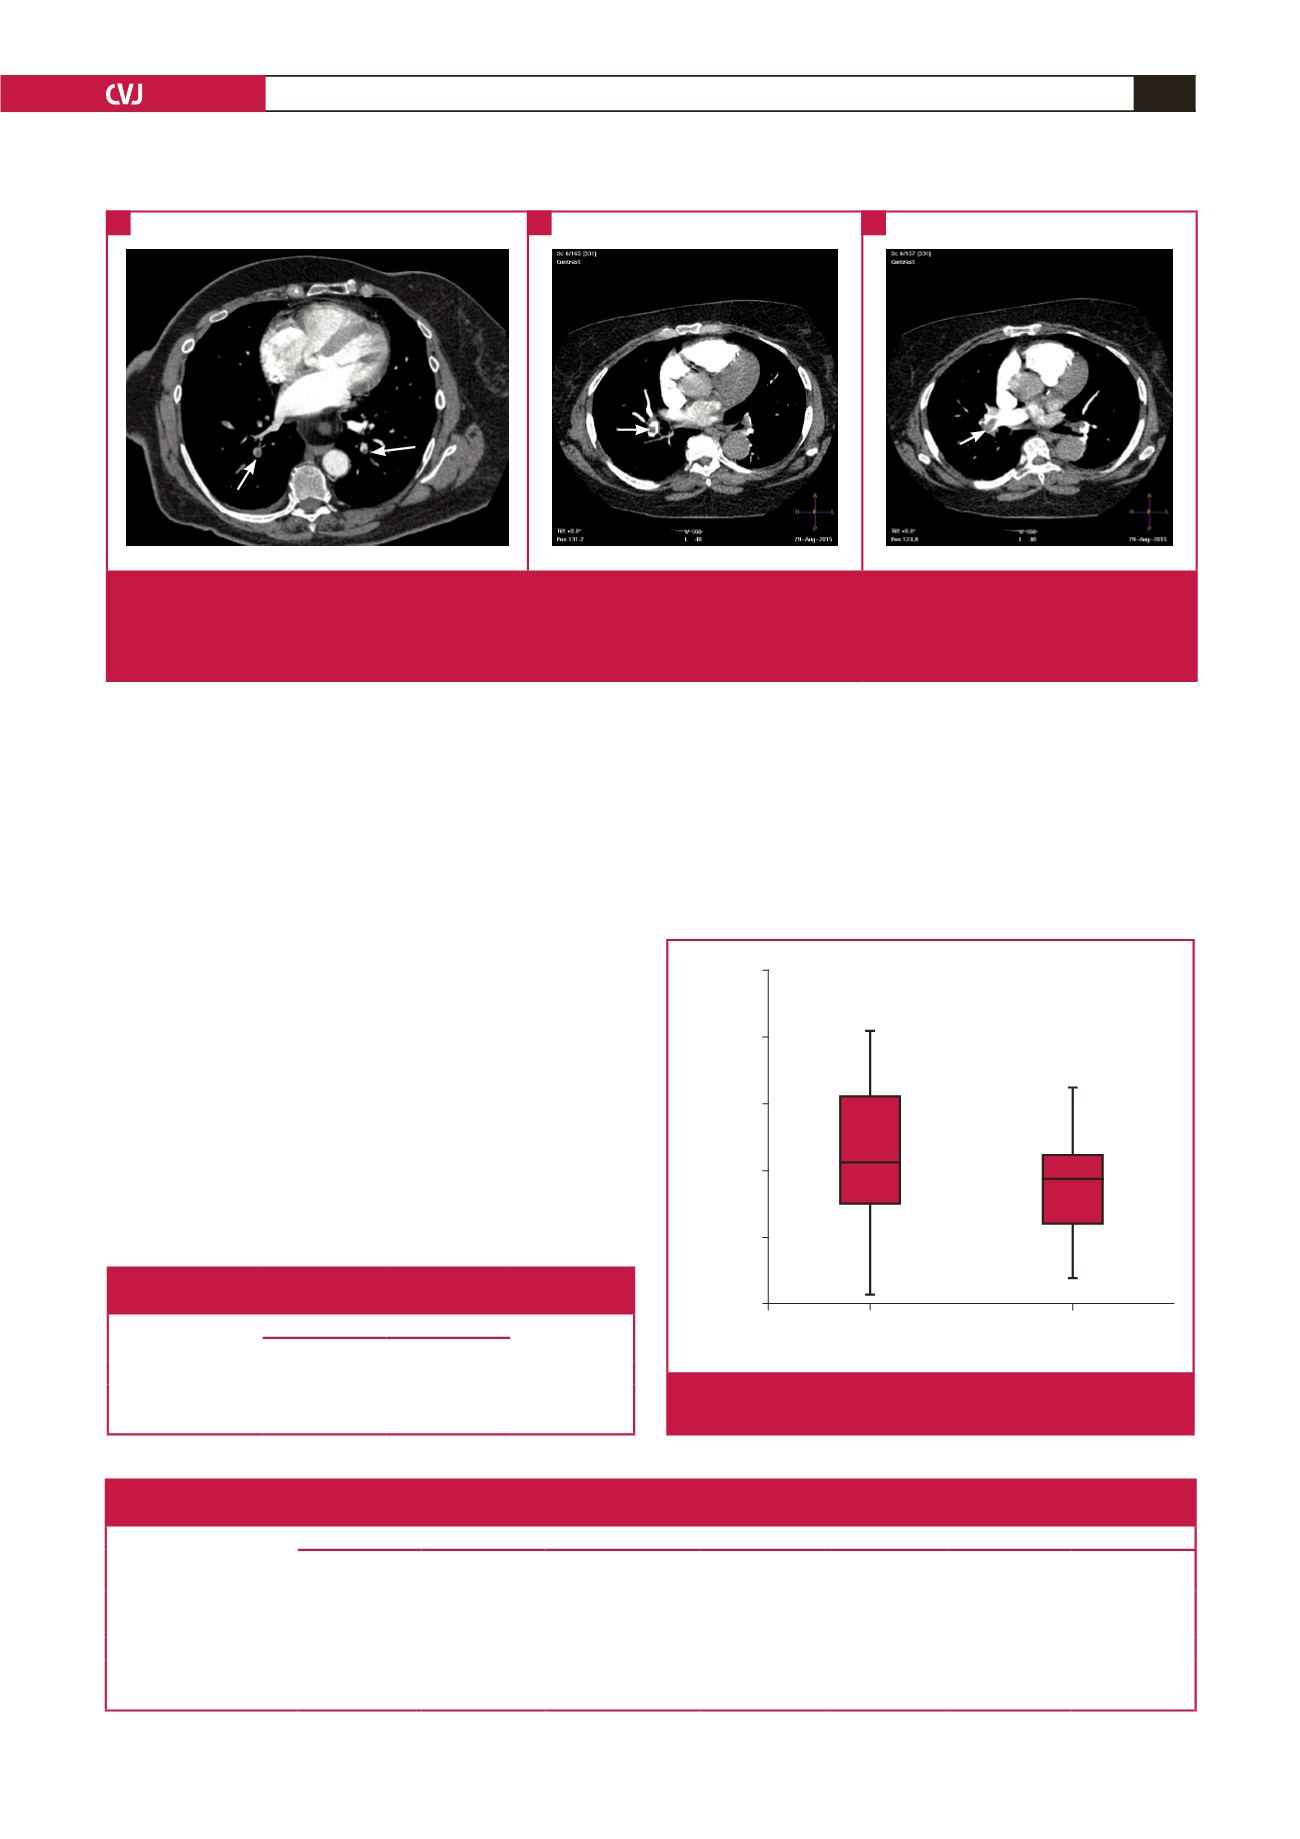
Comparisons between HIV-positive and -negative groups
with regard to Qanadli scores, and RV:LV and PA:AO ratios
are demonstrated in Figs 5–7. The Mann–Whitney
U
-test
demonstrated no significant differences between HIV-positive
and -negative categories for any of the above variables (
p
=
0.440,
p
=
0.611 and
p
=
0.191, respectively) in patients with PE.
Discussion
Prevalence of PE in a CTPA population
Previously published studies have reported the general prevalence
of PE in hospital populations. In our study, we differ in that we
report the prevalence of PE in a population of patients who
underwent CTPA for suspected PE. Similar studies evaluating
the presence of PE in a CTPA population are sparse. A study
in Cameroon (Africa), undertaken at a university-affiliated
hospital, demonstrated a CTPA incidence of PE of 32.4% over
a two-year period.
6
Our CTPA prevalence of PE is comparable
at 26%.
CTPA is a high-dose and costly study but can be performed at
most regional, some district and all tertiary institutions in South
Africa. Approximately 10 CT scans per month performed at our
study hospital were CTPAs, yet only a quarter of patients imaged
had positive findings of PE.
Table 8. Comparison of frequency (with percentages in brackets) of parenchymal and pleural complications present in
HIV-positive and -negative patients with pulmonary embolism (
n
=
33).
HIV status
Complications
Atelectasis
Consolidation
Wedge-shaped pleural-
based density
Ground-glass
opacity
Pleural effusion
None
*
Total
HIV positive,
n
(%)
10 (45.45)
15 (68.18)
4 (18.18)
9 (40.91)
10 (45.45)
2 (9.09)
22 (100)
HIV negative,
n
(%)
7 (63.64)
5 (45.45)
1 (9.09)
7 (63.64)
4 (36.36)
0 (0)
11 (100)
Total,
n
(%)
17 (51.52)
20 (60.61)
5 (15.15)
16 (48.48)
14 (42.42)
2 (6.06)
33 (100)
p
-value
0.465
0.270
0.643
0.282
0.719
0.542
*
Subjects who reported none of the named complications
Table 7. Comparison of the severity of the Qanadli score between
HIV-positive and -negative patients (
n
=
33)
HIV status
Qanadli score
Total
< 40%
≥ 40%
HIV positive,
n
(%)
10 (45.45)
12 (54.55)
22 (100)
HIV negative,
n
(%)
7 (63.64)
4 (36.36)
11 (100)
Total,
n
(%)
17 (51.52)
16 (48.48)
33 (100)
HIV status
HIV positive
HIV negative
Qanadli score
100
80
60
40
20
0
Fig. 5.
Differences between HIV positive and negative
according to Qanadli scores (
p
=
0.440).
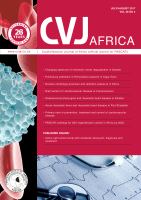
Fig. 4.
The CTPA appearances, showing the different degrees of obstruction in the lobar and segmental arteries, are depicted in
the series of images. (A) Axial CT scan showing partially occlusive thrombi (short arrows) in the right and left lower lobe
basal segmental arteries. (B) Axial CT scan showing partially occlusive thrombus (long arrow) in the right lower lobe artery.
(C) Axial CT scan showing totally occlusive thrombus (long arrow) in the right lower lobe artery.
A
B
C