


 24 / 62

CARDIOVASCULAR JOURNAL OF AFRICA • Volume 31, No 1, January/February 2020
22
AFRICA
window and a semi-automated segmentation program to segment
each clot from pulmonary CTA images and measure clot volume
(mm
3
). Clot assessment was done with regard to localisation
(central, lobar or distal) and clot volume.
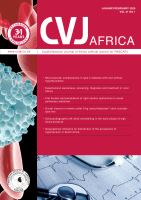
Pulmonary CTA signs were used to assess the function of
the right side of the heart, including: the ratio of RV to left
ventricular diameter (RV/LV ratio), ratio of main pulmonary
artery to ascending aorta diameter (PA/AO ratio), and the
superior vena cava diameter. The diameters of the right and left
ventricles were measured on the axial CTA image of the heart at
their widest point (Fig. 1), and the RV/LV ratio was calculated.
The diameters of the main PA and the AO were measured on
the transverse image at which the right pulmonary artery is in
contiguity with the main pulmonary artery. The PA/AO ratio
was calculated from this (Fig. 2).
For echocardiography, a Sonoscape A5 portable echo-
cardograph was used. Ideally, multiple parameters should be
used to determine RV systolic function.
7
Visual examination
is the most commonly used method to quantify RV function
(RVF) however it was proved that this method is not accurate if
used as a single parameter for evaluation of RVF. Therefore the
guidelines suggest using at least one of the following parameters
to quantify RVF: fractional area change (FAC), tissue Doppler
of the free lateral wall (S
′
), and tricuspid annular plane systolic
excursion (TAPSE) with or without RV index of myocardial
performance (RIMP).
8,9
In our study, we used the following parameters to assess right
cardiac function:
•
Assessment of RV dilatation.
•
Pulmonary artery systolic pressure.
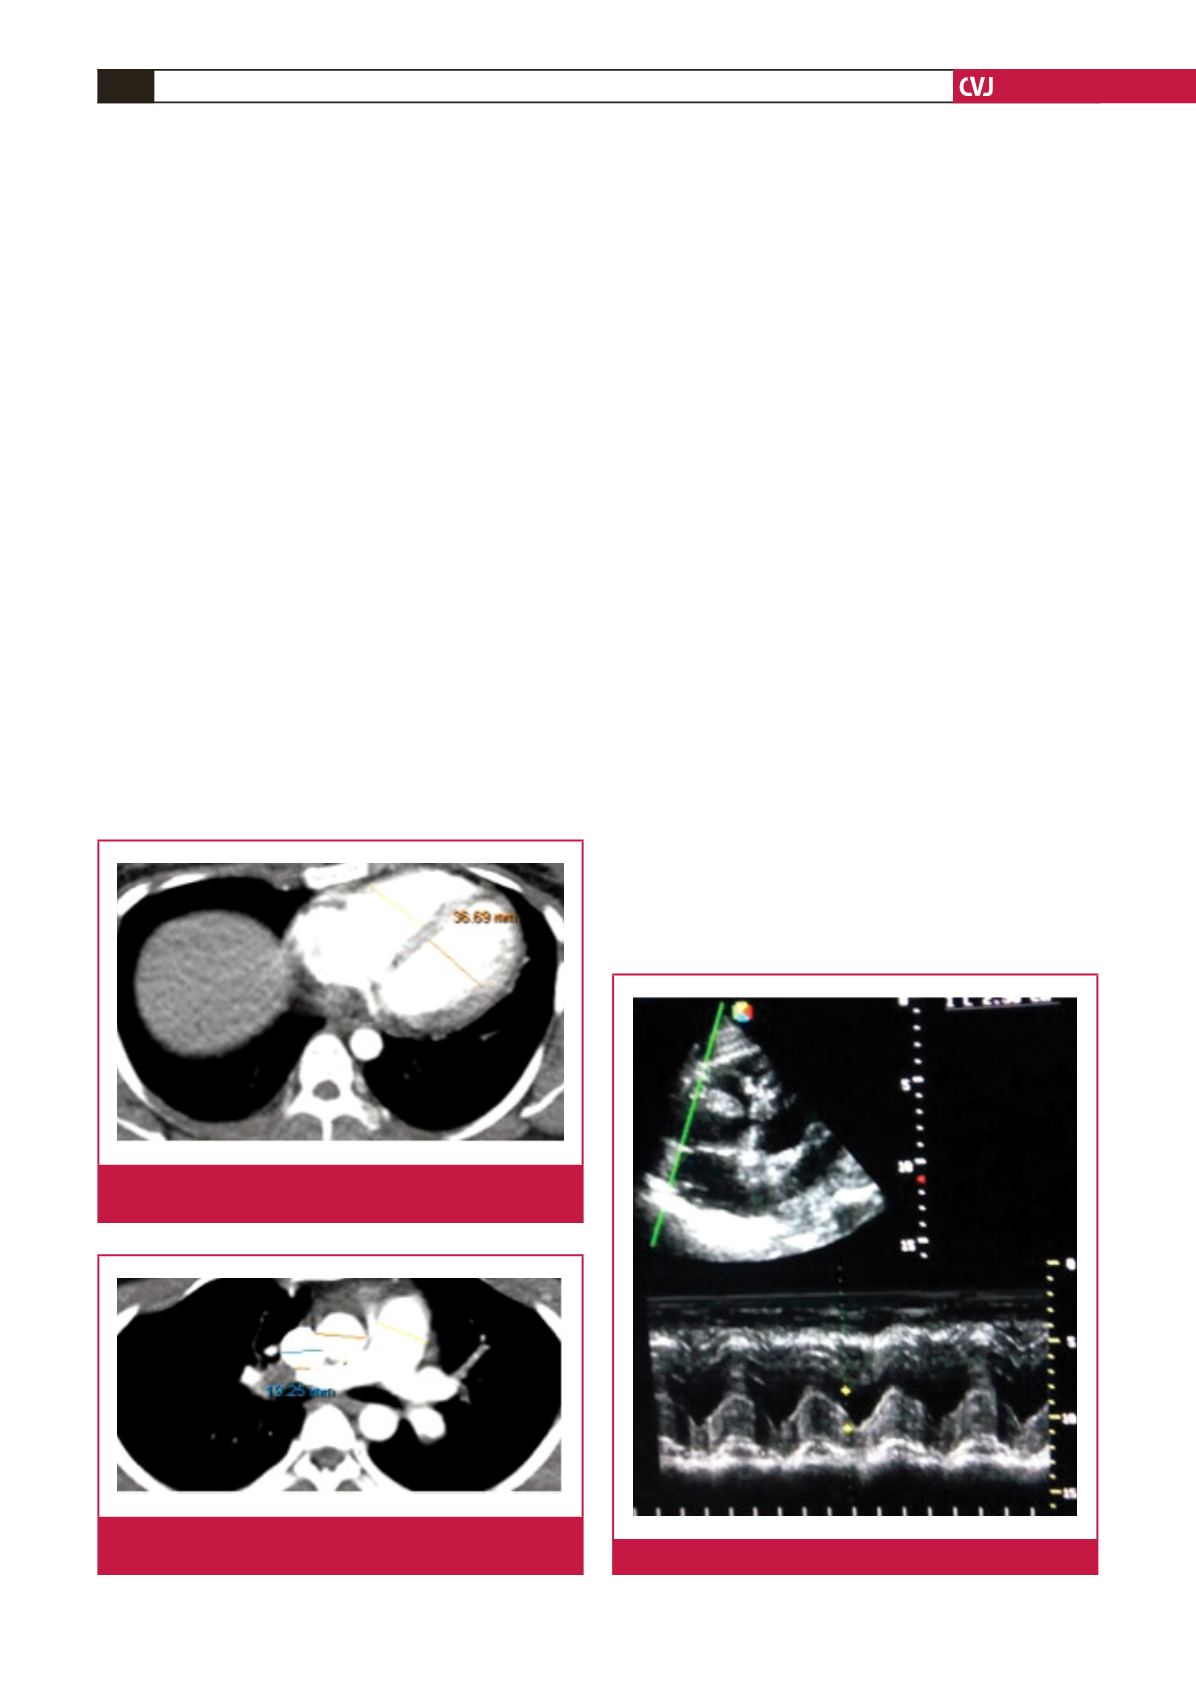
•
TAPSE, which represents a measure of RV longitudinal func-
tion. It is measured by M-mode echocardiography with the
cursor optimally aligned along the direction of the tricuspid
lateral annulus in the apical four-chamber view, measuring
the amount of longitudinal motion of the annulus at peak
systole (Fig. 3).
•
Tissue Doppler imaging (TDI)-derived tricuspid lateral annu-
lar systolic velocity (S
′
), which correlates well with other
measures of global RV systolic function.
•
The RV myocardial performance index (MPI) or Tei index,
which is an index of global RV performance. The isovolumic
contraction time, isovolumic relaxation time and ejection time
intervals were measured. This reflects both systolic and dias-
tolic RV function. MPI is defined as the sum of isovolumic
contraction time (IVCT) and isovolumic relaxation (IVRT)
time, divided by the ejection time (ET) of the RV (Fig. 4).
Statistical analysis
SPSS version 16 was used in the analysis of data. Spearman
correlation was used to test the association between clot volume
and other continuous variables, while the Kruskal–Wallis test
was used to test the association between categorical variables and
clot volume. The
post hoc
Mann–Whitney
U
-test was applied
to indicate which groups had significant associations with clot
volume. Linear regression was used to evaluate the contribution
of factors found to be significant in bivariate analysis in
predicting clot volume.
Fig. 1.
Measurements of maximal RV and LV diameters in
pulmonary CTA.
Fig. 2.
Measurements of PA, AO and superior vena cava
diameters in pulmonary CTA.
Fig. 3.
Echocardiographic measurement of TAPSE.