


 25 / 62

CARDIOVASCULAR JOURNAL OF AFRICA • Volume 31, No 1, January/February 2020
AFRICA
23
Results
Seventy patients with acute PE were evaluated and 34 (48.6%)
were male. Mean age was 43 ± 15 years. Five patients (14.3%) were
haemodynamically unstable at admission. Patient characteristics
are shown in Table 1.
Localisation of emboli was central in 40 patients (57.14%),
lobar in 18 (25.71%) and distal in 12 patients (17.14%). Saddle
emboli were observed in eight patients (11.42%).
The median clot volume measured in all patients was 4 285
mm
3
(1 650–11 226) (minimum – maximum). No correlation
was found between clot volume and age (
p
=
0.24) or gender (
p
=
0.86). Bivariate analysis using the Kruskal–Wallis test showed
that there were significant associations between clot volume
and the presence of auto-immune disease (
p
=
0.028) and
hypotension (
p
=
0.002).
Regarding pulmonary CTA parameters, a significant
correlation was found between clot volume and the following
parameters of RV dysfunction: RV diameter (
p
<
0.001), RV/LV
ratio (
p
=
0.01), PA diameter (
p
=
0.01), PA/AO ratio (
p
=
0.04)
and superior vena cava diameter (
p
=
0.01) (Table 2).
On other hand, regarding echocardiography, there was no
significant correlation found between clot volume and the
following echocardiographic parameters of RV function: TAPSE
(
p
=
0.091), S wave (
p
=
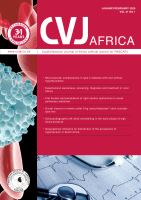
0.667), Tei index (
p
=
0.985), pulmonary
artery systolic pressure (
p
=
0.173) and RV diameter (
p
=
0.231)
(Table 2).
Discussion
PE is associated with a high risk of morbidity and mortality,
mainly resulting from RV dysfunction. The effect of PE
on RV function can be evaluated by either transthoracic
echocardiography or pulmonary CTA.
10
Echocardiography is
less costly than the other techniques available and remains
the first-line examination technique for the RV. However, RV
evaluation through echocardiography remains difficult because
of the complex anatomy of the RV, its retrosternal position,
and the interposition of the lungs.
11
In addition, studies
comparing severity of clot load with RV burden assessed by
echocardiography have reported controversial results.
10
Pulmonary CTA, on the other hand, is the method of
choice for the diagnosis of PE. It can also identify signs
of RV dysfunction that may have prognostic significance or
implications for treatment, for example, need for the institution
of thrombolytic therapy versus conventional anticoagulation
alone. Therefore there has been interest in inferring measures of
RV dysfunction from pulmonary CTA.
12
The results of our study showed a good correlation between
clot burden and signs of RV dysfunction assessed by pulmonary
CTA, but did not demonstrate a good correlation with those
commonly used signs assessed by echocardiography. Different
echocardiographic and CTA parameters of RV dysfunction
were used in previous studies to assess its correlation with clot
burden. Rodrigues
et al.
10
assessed the effect of pulmonary
vascular obstruction severity on RV function in patients with
acute PE and concluded that no significant correlation was
found between clot burden and echocardiographic parameters.
These results could support our finding despite the fact that they
used quantitative parameters such as fractional area change and
pulmonary systolic pressure.
On the hand, another study was performed by Rodrigues
et
al.
13
to evaluate the correlation between a score of angiographic
embolic load (Qanadli score, QS) and the parameters of RV
dysfunction. They found that a QS > 18 points proved to be an
independent predictor of RV dysfunction in acute PE, where
echocardiography showed higher pulmonary artery systolic
Table 1. Characteristics of the study population
Characteristic
Value
Gender
Male,
n
(%)
34 (48.6)
Female,
n
(%)
36 (51.4)
Age (mean ± SD) years
43 ± 15
Risk factors
Cancer,
n
(%)
20 (28.5)
Orthopedic surgery,
n
(%)
10 (14.28)
Auto-immune disease,
n
(%)
18 (25.7)
Heart failure,
n
(%)
8 (11.4)
Postpartum,
n
(%)
8 (11.4)
Immobilisation,
n
(%)
6 (8.5)
Table 2. Correlation between clot volume and different
imaging parameters
Parameters
Mean
SD
Correlation
coefficient
(rho)
p-
value
CT angiography
RV diameter (mm)
33.8603
6.26018
0.417
<
0.001
RV/LV
0.9331
0.18969
0.304
0.011
PA diameter (mm)
28.4651
5.30013
0.297
0.013
PA/AO
0.9023
0.16398
0.245
0.041
SVC diameter (mm)
18.3343
4.01406
0.287
0.016
Echocardiography
TAPSE
1.9355
0.45778 –0.258
0.091
S wave
9.3790
1.93405 –0.068
0.667
Tei index
0.3875
0.23753
0.003
0.985
PASP
34.3471
16.31748
0.239
0.173
RV diameter
4.6875
0.86922
0.317
0.231
SD: standard deviation, RV diameter: right ventricular diameter, RV/LV: right
ventricular/left ventricular ratio, PA diameter: pulmonary artery diameter, PA/
AO: pulmonary artery/aorta ratio, SVC diameter: superior vena cava diameter,
TAPSE: tricuspid annular plane systolic excursion, S wave: tissue Doppler
imaging (TDI)-derived tricuspid lateral annular systolic velocity, Tei index: RV
myocardial performance index, PASP: pulmonary artery systolic pressure.
Fig. 4.
Echocardiographic measurement of Tei index.