


 30 / 62

CARDIOVASCULAR JOURNAL OF AFRICA • Volume 31, No 1, January/February 2020
28
AFRICA
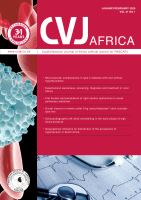
Results
The highest serum BNP (298.15
±
36.98 ng/l) and cTnI (180.32
±
19.69 pg/ml) levels were detected in the ES group. Significantly
lower levels were detected in the Sal intervention groups.
Compared with the control group, significantly higher
myocardial ROS levels were observed in the other groups (ES,
SLE and SHE) (
p
<
0.05,
n
=
6). Significantly lower ROS levels
were detected in the SLE (6.25
±
0.36 ng/mg) and SHE (4.91
±
0.74 ng/mg) groups than in the ES group (7.66
±
0.81 ng/mg,
p
<
0.01,
n
=
6). Significantly lower ROS levels were observed in
the SHE than the SLE group. Myocardial oxidative stress levels
were significantly increased by the acute exhaustion produced
by swimming, and myocardial ROS levels were reduced by Sal.
Myocardial CAT levels were significantly lower in the SLE,
SHE and ES groups than in the control group (0.60
±
0.04
ng/mg). Compared with the ES group, significantly higher
myocardial CAT levels were observed in the SLE and SHE
groups (
p
<
0.01,
n
=
6).
Significantly lower myocardial GSH levels were detected in
the ES, SLE and SHE groups than in the control group (3.30
±
0.45 U/mg). A significantly higher GSH level was observed in the
SHE than in the ES group (
p
<
0.05,
n
=
6) (Fig. 1).
Compared with the control group, the HR, Pes, dP/dt
max
and –dP/dt
min
were lower in the ES group, and the Ved, Ves, Ped,
EDPVR and Tau were all higher. The differences in SV, Ved, Ped
and Tau were significant between the Sal intervention groups
and the control group. The Pes, dP/dt
max
, –dP/dt
min
, Tau and
EDPVR were substantially higher in the SLE and SHE groups
than in the ES group. Compared with the control group, a lower
HR was recorded in the SLE and ES groups.
Non-significant differences in EF and ESPVR were observed
between the groups (
p
>
0.05,
n
=
6). Non-significant differences
in EF and ESPVR were also observed between the SLE and SHE
groups (Table 1).
HR was increased in the ES group (
p
<
0.05,
n
=
6). The PR
and QTc intervals were significantly longer in the ES, SLE and
SHE groups than in the control group. A larger R amplitude
was observed in the ES group (
p
<
0.01,
n
=
6), but a smaller
amplitude was observed in the SLE and SHE groups than in
the ES group (
p
<
0.01,
n
=
6). However the QT interval and P
amplitude were significantly higher in the ES and SLE groups.
The ST-segment of the ES group was changed (Table 2).
Compared with the control group (0.71
±
0.17), the change
in expression of Nrf2 mRNA was not statistically significant.
Compared with the ES group (0.57
±
0.13), a non-significant
change in expression of Nrf2 mRNA was observed in the SLE
(0.59
±
0.18) and SHE groups (0.54
±
0.06) after the application
of Sal. A non-significant change in expression of Keap1 mRNA
was observed (Fig. 2).
Compared with the control group (0.39
±
0.07), the level
of Nrf2 protein in the ES group (0.43
±
0.06) did not change
significantly. However, significantly higher levels of Nrf2 protein
were detected in the myocardium and nuclei of the SLE and SHE
groups (
p
<
0.01,
n
=
6). Compared with the SLE group (0.48
±
0
50
100
150
200
250
300
350
400
Con
ES
SLE
SHE
The l evel of BNP i n ser um
( ng/ L)
Serum BNP level (ng/ml)
**
**
#
##
**
Serum cTnI level (pg/ml)
0
50
100
150
200
250
Con
ES
SLE
SHE
The l evel of cTnI i n ser um
( pg/ mL)
**
**
**
#
#
0
1
2
3
4
5
6
7
8
9
Con
ES
SLE
SHE
The l evel of ROS i n myocar di um
( ng· mg- 1)
Myocardial ROS level (ng/mg)
##
##
++
**
**
**
0
0. 1
0. 2
0. 3
0. 4
0. 5
0. 6
0. 7
Con ES
SLE SHE
The l evel of CAT i n myocar di um
( ng· mg- 1)
Myocardial CAT level (ng/mg)
**
##
**
##
*
0
0. 5
1
1. 5
2
2. 5
3
3. 5
4
Con ES SLE SHE
The l evel of GSH i n myocar di um
( u· mg- 1)
Myocardial GSH level (U/mg)
**
**
#
**
Fig. 1.
The effect of Sal on serum BNP, cTnI and ROS levels, CAT and GSH in the myocardium after exhaustive exercise. The data
are presented as means
±
SD,
n
=
6 animals per group. BNP: brain natriuretic peptide; cTnI: cardiac troponin I; ROS: reactive
oxygen species; CAT: catalase; GSH: glutathione; Con: control group; ES: acute exhaustive swimming group; SLE: low-dose
salidroside plus exhaustive swimming group; SHE: high-dose salidroside plus exhaustive swimming group.
*
p
<
0.05 and
**
p
<
0.01 compared with the control group;
#
p
<
0.05 and
##
p
<
0.01 compared with the ES group;
++
p
<
0.01 compared with the
SLE group.