


 31 / 62

CARDIOVASCULAR JOURNAL OF AFRICA • Volume 31, No 1, January/February 2020
AFRICA
29
0.11), nuclear Nrf2 levels were significantly increased in the SHE
group (0.61
±
0.08) (
p
<
0.01,
n
=
6).
Compared with the control group (0.96
±
0.03), Keap1 protein
was expressed at lower levels in the other groups (
p
<
0.01,
n
=
6).
The level of Keap1 protein was significantly reduced in the SLE
(0.66
±
0.06) and SHE groups (0.52
±
0.03) compared to the ES
group (0.72
±
0.04), and it was expressed at significantly lower
levels in the SHE than in the SLE group (
p
<
0.01,
n
=
6) (Fig. 3).
In the control group, Pearson’s correlation coefficient between
the T amplitude and level of Nrf2 protein was –0.944 (
p
<
0.05),
indicating a negative correlation. In the ES group, Pearson’s
correlation coefficient for dP/dt
max
with nuclear Nrf2 was 0.836
(
p
<
0.05). Nuclear Nrf2 levels positively correlated with the R
amplitude, and Pearson’s correlation coefficient was 0.921 (
p
<
0.01). Keap1 level was positively correlated with the QT interval
(
r
=
0.934,
p
<
0.05). In the SLE group, nuclear Nrf2 levels were
positively correlated with the P amplitude, with a correlation
coefficient of
r
=
0.875 (
p
<
0.05). In the SHE group, the P
amplitude was negatively correlated with levels of Nrf2 protein
(
r
=
–0.817,
p
<
0.05) (Table 3).
Expression levels of target proteins were divided by the
expression level observed in the control group. Then we obtained
the multiples of activated Nrf2 and inhibited Keap1. The effect
of Sal on myocardial Nrf2 activation, nuclear translocation of
Nrf2 and inhibition of Keap1 were analysed using a single-factor
regression analysis (
n
=
6). Myocardial Nrf2 expression increased
with increasing Sal concentrations (
y
=
0.0429
x
+ 1.112,
p
<
0.05). Moreover, nuclear translocation of Nrf2 also increased
with increasing Sal concentrations (
y
=
0.1195
x
+ 1.557), while
the expression of Keap1 decreased (
y
=
–0.0068
x
+ 0.7592);
however, the differences were not significant (
p
>
0.05) (Fig. 4).
Discussion
In this study, Sal improved cardiac function and
electrocardiography in exhausted rats. Regarding the mechanism,
for the first time, we revealed that Sal induced Nrf2 expression
and increased nuclear translocation of Nrf2. Sal intervention did
Table 1.The effect of Sal on cardiac function parameters in exhausted rats
Parameter
Control
ES
SLE
SHE
SV (
μ
l)
122.10
±
10.77 166.70
±
16.71
**
176.14
±
22.69
**
183.74
±
19.34
**
Ves (
μ
l)
71.88
±
6.38 96.21
±
9.36
**
83.22
±
14.99 85.34
±
14.80
Ved (
μ
l)
183.60
±
29.82 249.09
±
10.46
**
257.48
±
11.45
**
262.40
±
19.12
**
Pes (mmHg) 93.05
±
11.68 71.45
±
8.93
**
92.11
±
6.04
##
99.25
±
5.57
##
Ped (mmHg) 5.05
±
3.30 7.88
±
2.04
*
6.69
±
0.86
*
6.60
±
1.2
*
HR (bpm)
375
±
31
298
±
41
**
309
±
24
**
345
±
12
Systolic indices
EF (%)
72.17
±
6.36 69.05
±
4.00 72.29
±
4.07 70.02
±
5.83
dP/dt
max
(mmHg/s)
7884
±
1538 4756
±
627
**
7121
±
1204
#
8883
±
616
##
ESPVR 1.28
±
0.82 1.21
±
0.27
1.30
±
0.32
1.32
±
0.35
Diastolic indices
–dP/dt
min
(mmHg/s)
–6336
±
1643 –3904
±
826
*
–4906
±
936
##
–7361
±
790
##
Tau (ms)
6.06
±
0.77 14.55
±
2.36
**
11.08
±
1.36
**#
10.69
±
1.35
**#
EDPVR 0.022
±
0.012 0.036
±
0.009
**
0.025
±
0.005
#
0.020
±
0.007
##
The data are presented as means
±
SD,
n
=
6 animals per group.
SV: stroke volume; Ves: end-systolic volume; Ved: end-diastolic volume; Pes:
end-systolic pressure; Ped: end-diastolic pressure; HR: heart rate; EF: ejec-
tion fraction; dP/dt
max
: peak rate of the increase in pressure; ESPVR: slope of
end-systolic pressure volume relationship; –dP/dt
min
: peak rate of the decrease
in pressure; Tau: relaxation time constant; EDPVR: slope of end-diastolic pres-
sure–volume relationship; ES: acute exhaustive swimming group; SLE: low-dose
salidroside plus exhaustive swimming group; SHE: high-dose salidroside plus
exhaustive swimming group.
*
p
<
0.05 and
**
p
<
0.01 compared with the control group;
#
p
<
0.05 and
##
p
<
0.01
compared with the ES group.
Table 2.The effect of Sal on changes in ECG parameters in exhausted rats
Parameters
Control
ES
SLE
SHE
RR interval (ms)
15.70
±
0.97 14.04
±
1.27
*
15.49
±
2.02 15.56
±
1.14
Heart rate (bpm)
392
±
21
444
±
37
**
412
±
33
405
±
30
PR interval (ms)
4.18
±
0.28 4.64
±
0.43
*
4.77
±
0.39
**
4.61
±
0.48
*
P duration (ms)
1.64
±
0.24 1.48
±
0.24 1.54
±
0.27 1.65
±
0.23
QRS interval (ms) 1.96
±
0.19 1.96
±
0.18 1.98
±
0.33 1.84
±
0.38
QT interval (ms)
5.96
±
0.55 6.96
±
0.95
*
7.02
±
0.97
*
6.83
±
0.98
QTc interval (ms)
14.62
±
1.73 19.70
±
1.87
**
18.07
±
3.14
**
18.42
±
2.44
**
P amplitude (mV) 0.069
±
0.022 0.120
±
0.036
**
0.112
±
0.028
*
0.096
±
0.017
R amplitude (mV) 0.514
±
0.073 0.722
±
0.107
**
0.578
±
0.088
##
0560
±
0.084
##
ST height (mV)
0.033
±
0.072 0.105
±
0.050
*
0.064
±
0.067 0.045
±
0.019
T amplitude (mV) 0.140
±
0.070 0.174
±
0.059 0.156
±
0.053 0.143
±
0.041
The data are presented as means
±
SD,
n
=
6 per group.
ES: acute exhaustive swimming group; SLE: low-dose salidroside plus exhaustive
swimming group; SHE: high-dose salidroside plus exhaustive swimming group.
*
p
<
0.05 and
**
p
<
0.01 compared with the control group;
##
p
<
0.01 compared
with the ES group.
0
0. 1
0. 2
0. 3
0. 4
0. 5
0. 6
0. 7
0. 8
0. 9
1
Con
ES
SLE
SHE
Rel at i ve mRNA l evel of Nr f 2
Relative RNA level of rf2
0
0. 5
1
1. 5
2
2. 5
3
Con
ES
SLE
SHE
Rel at i ve mRNA l evel of Keap1
l tive mR l v l of Keap1
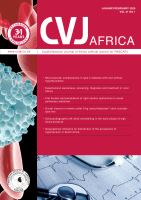
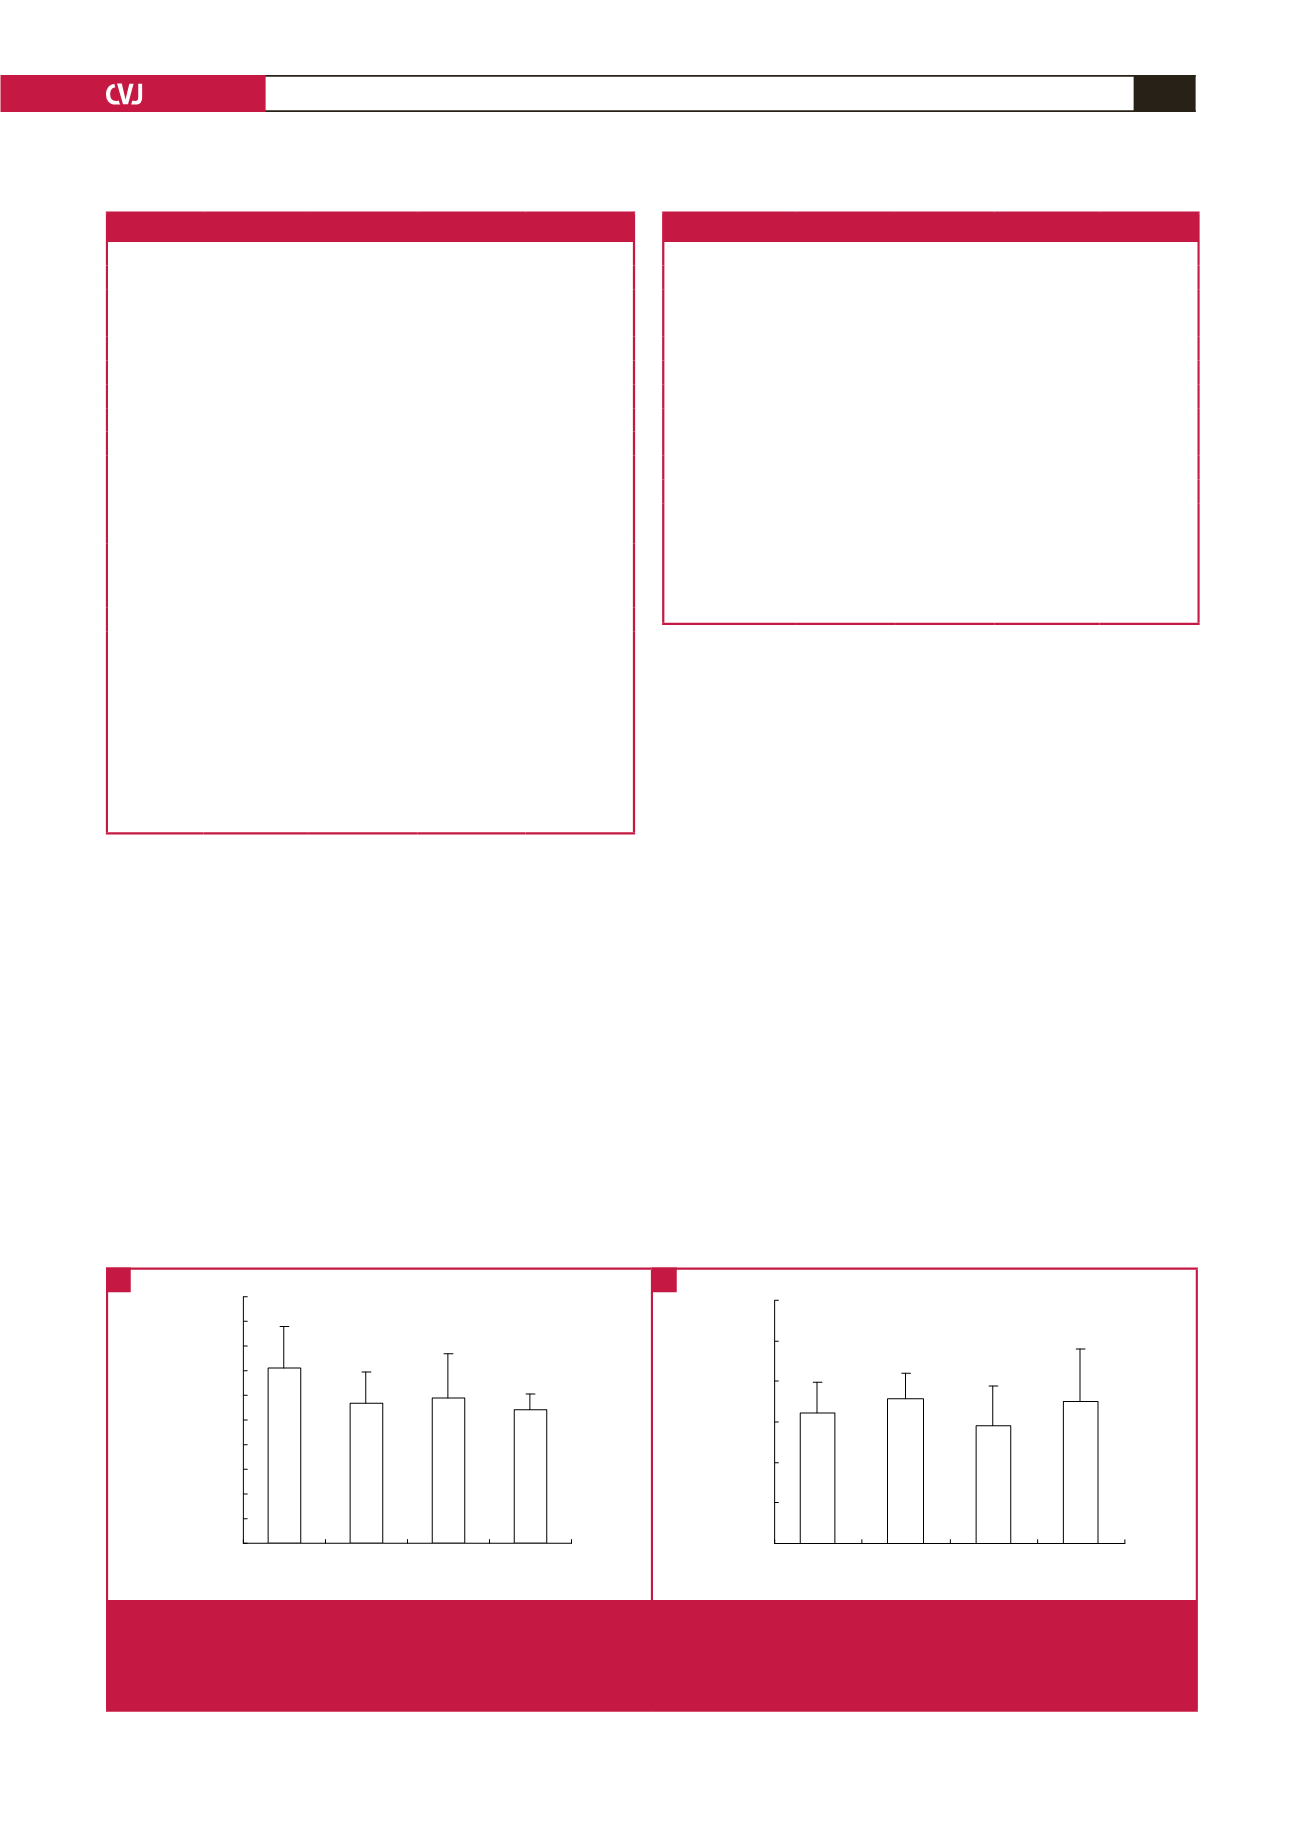
Fig. 2.
The effect of Sal on expression of Nrf2 and Keap1 mRNA after exhaustive exercise. The data are presented as means
±
SD,
n
=
6 animals per group. A: Relative levels of Nrf2 mRNA in rat myocardium. B: Relative levels of Keap1 mRNA in rat
myocardial tissue. Con: control group; ES: acute exhaustive swimming group; SLE: low-dose salidroside plus exhaustive
swimming group; SHE: high-dose salidroside plus exhaustive swimming group.
A
B