


 10 / 64

CARDIOVASCULAR JOURNAL OF AFRICA • Volume 31, No 5, September/October 2020
230
AFRICA
lipoprotein cholesterol > 130 mg/dl (3.37 mmol/l), triglycerides
> 150 mg/dl (1.69 mmol/l) or the use of a lipid-lowering drug.
Statistical analysis
The results were statistically evaluated with SPSS 16.0 (SPSS
Inc, Chicago, IL, USA) analysis program for Windows. The
distribution of the results was determined with the Kolmogorov–
Smirnov test. Continuous variables are shown as means with
standard deviations or medians in the 25th–75th percentiles.
Categorical variables are represented as numbers with
percentages. Continuous data were analysed with the Student’s
t
-test for normally distributed variables and the Mann–Whitney
U
-test was used for non-normally distributed variables. Aside
from white blood cells (WBC) and calcium, all continuous
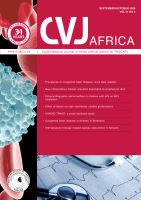
Fig. 2.
Demonstration of a fusiform ectasia in the left anterior
descending artery in the region between the white
arrows.
Fig. 3.
Demonstration of a fusiform ectasia in the circumflex
artery in the region between the white arrows.
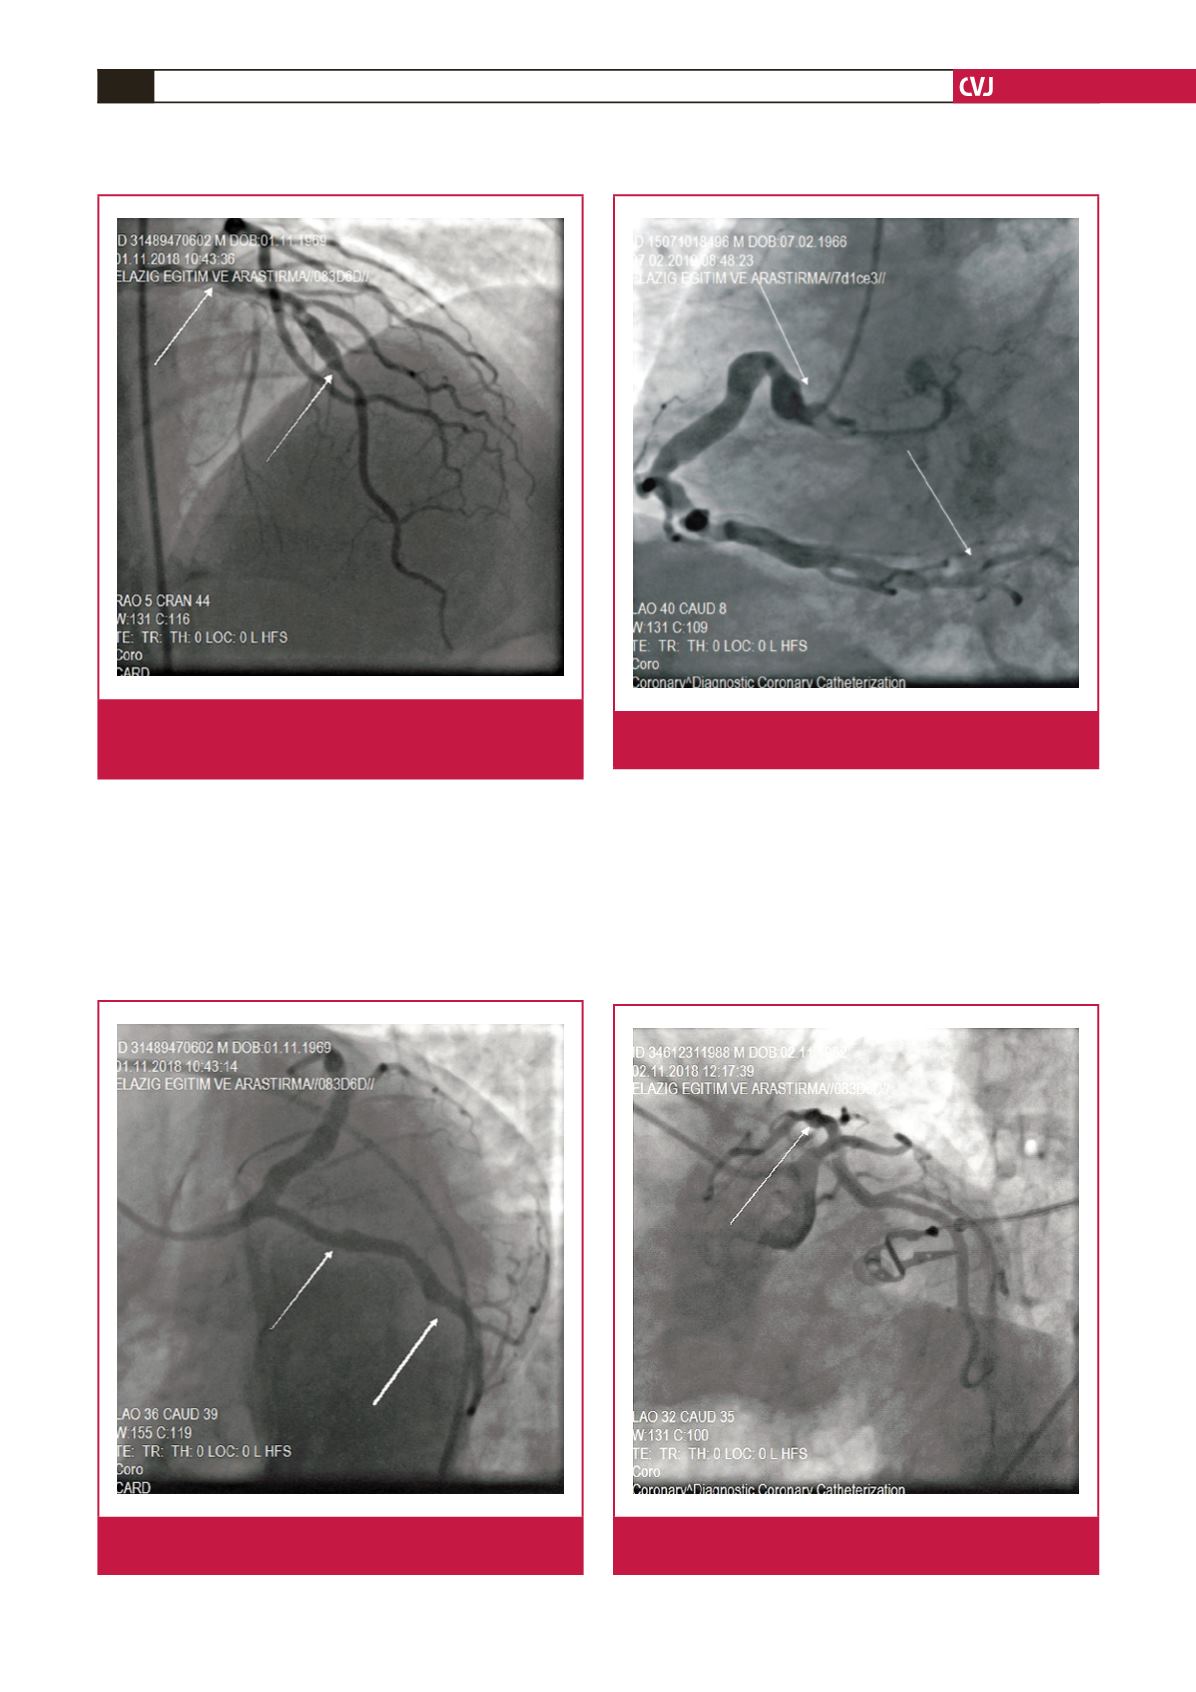
Fig. 4.
Demonstration of a fusiform ectasia in the right coro-
nary artery in the region between the white arrows.
Fig. 5.
Demonstration of a saccular ectasia in the left anterior
descending artery, shown with a white arrow.