


 11 / 64

CARDIOVASCULAR JOURNAL OF AFRICA • Volume 31, No 5, September/October 2020
AFRICA
231
variables were not distributed normally, and the Mann–Whitney
U-
test was used to compare these variables. Categorical data
were analysed using the chi-squared test. The Bonferroni test
was used to validate one-way ANOVA analysis for comparison
between groups (among Markis I, II, III and IV and among
one-, two- and three-vessel disease). The receiver operating
characteristics (ROC) test was used to estimate the sensitivity
and specificity of ELR and its optimal cut-off value. Correlation
analyses were fulfilled using Spearman’s correlation test;
p
<
0.05
was considered to indicate statistical significance.
Results
The records of 16 240 patients who underwent coronary
angiography were retrospectively screened, of whom 232 patients
with isolated CAE (141 males) and 247 age- and gender-matched
subjects with NCA (130 males) were detected. It was observed
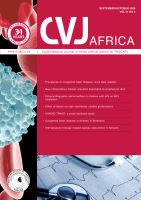
that WBC and eosinophil counts and ELR for the isolated CAE
group were significantly higher than in the NCA group 8.11
±
1.75 vs 7.49
±
1.80
×
10
9
cells/l,
p
<
0.0001; 0.22 (0.13–0.32)
vs 0.19 (0.12–0.28)
×
10
9
cells/l,
p
=
0.02; 0.11 (0.06–0.17) vs
0.08 (0.05–0.12)
p
<
0.0001, respectively (Table 1, Fig. 6).
However, high-density lipoprotein cholesterol (HDL-C) level
and lymphocyte count for the NCA group were significantly
higher than in the isolated CAE group [47.0 (40.9–55.2) vs 42.0
(36.0–49.0) mg/dl
=
1.22 (1.06–1.43) vs 1.09 (0.93–1.27) mmol/l,
p
<
0.0001; 2.18 (1.80–2.90) vs 2.05 (1.62–2.54)
×
10
9
cells/l,
p
=
0.002, respectively) (Table 1).
Eosinophil and lymphocyte counts were not significantly
different among patients with one-, two- and three-vessel isolated
CAE (Table 2). Likewise, the eosinophil and lymphocyte counts
were not significantly different among Markis types I, II, III
and IV (Table 3). However, the ELR for three-vessel isolated
CAE was significantly higher than for one-vessel isolated CAE
(
p
=
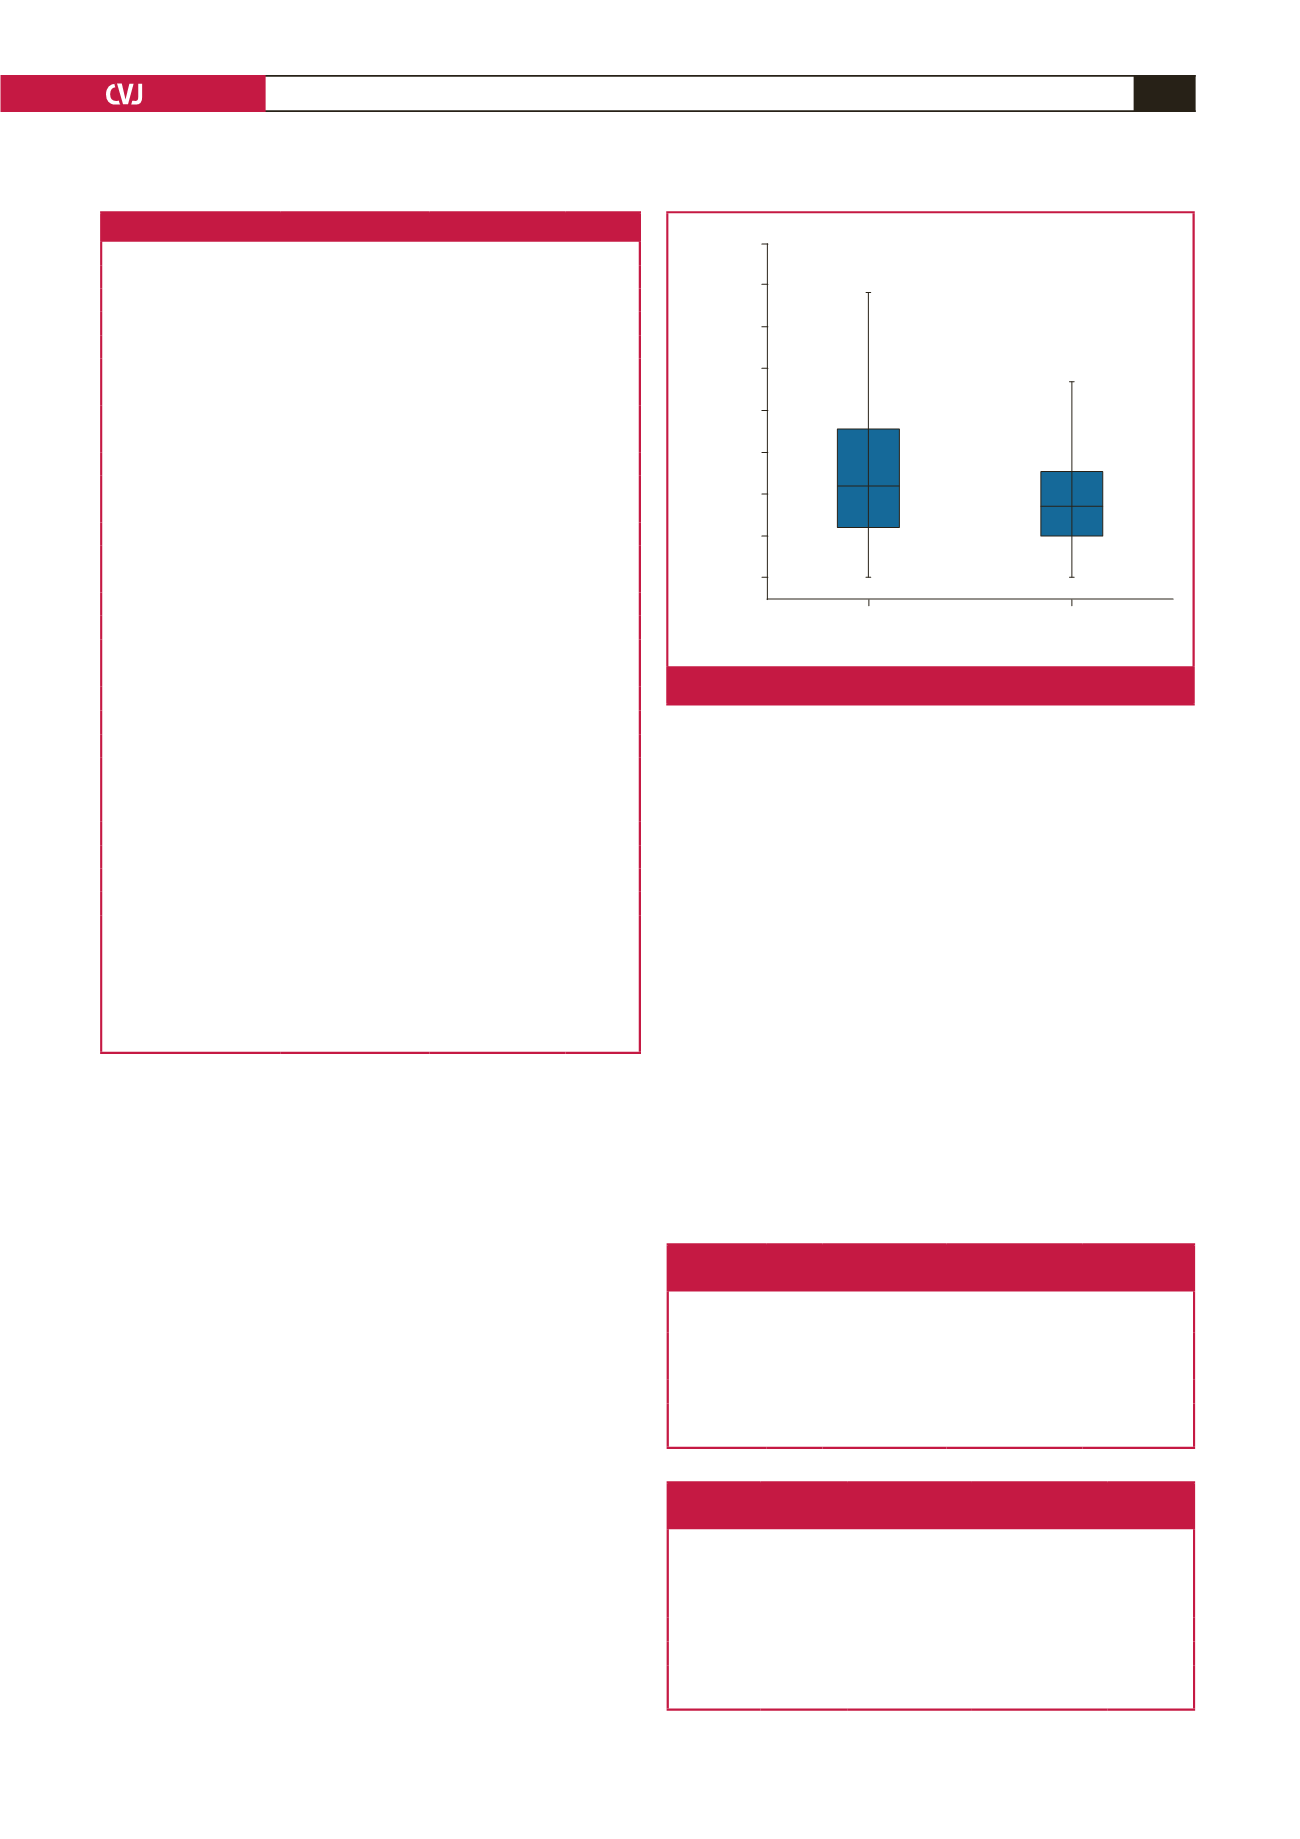
0.04) (Table 2). Furthermore, the ELR for Markis I was
significantly higher than for Markis IV (
p
=
0.04) (Table 3, Fig.
7).There were no statistically significant differences between
focal (Markis type IV) and diffuse ectasia (Markis type I, II and
III) in terms of eosinophil count (
p
=
0.54) (Table 4). In contrast,
the ELR for diffuse ectasia (Markis type I, II and III) was
significantly higher compared to focal (Markis type IV) ectasia,
and the lymphocyte count for diffuse ectasia (Markis types I, II
and III) was significantly lower than for focal (Markis type IV)
ectasia (
p
=
0.02;
p
=
0.001, respectively) (Table 4).
Table 1. Inter-group comparison of demographic and laboratory data
Parameters
Isolated CAE (232)
NCA (247)
p-value
Gender,
n
(male/ female)
141/91
130/117
0.07
Hypertension,
n
(%)
72/232 (31.0)
64/247 (25.9)
0.21
Hyperlipidaemia,
n
(%)
82/232 (35.3)
71/247 (28.7)
0.12
Diabetes mellitus,
n
(%)
50/232 (21.6)
49/247 (19.8)
0.64
Smoking,
n
(%)
79/232 (34.1)
76/247 (30.8)
0.44
Age (year)
56.0 (53.0–60.0)
55.0 (52.0–59.0)
0.15
Platelets (
×
10
9
cells/l)
257.0 (223.0–296.75) 250.0 (209.0–292.0)
0.10
Glucose (mg/dl)
100.0 (89.25–110.30) 99.0 (90.0–109.0)
0.25
(mmol/l)
5.55 (4.95–6.12)
5.49 (5.0–6.05)
Triglycerides (mg/dl)
133.5 (100.25–190.25) 131.7 (95.0–152.0)
0.09
(mmol/l)
1.51 (1.13–2.15)
1.49 (1.07–1.72)
LDL-C (mg/dl)
115.0 (92.0–134.25) 112.0 (88.0–125.0)
0.06
(mmol/l)
2.98 (2.38–3.48)
2.90 (2.28–3.24)
Total cholesterol (mg/dl)
186.0 (160.0–213.5) 185.2 (161.0–203.0)
0.65
(mmol/l)
4.82 (4.14–5.53)
4.80 (4.17–5.26)
HDL-C (mg/dl)
42.0 (36.0–49.0)
47.0 (40.9–55.2)
<
0.0001
(mmol/l)
1.09 (0.93–1.27)
1.22 (1.06–1.43)
Eosinophils (
×
10
9
cells/l)
0.22 (0.13–0.32)
0.19 (0.12–0.28)
0.02
Lymphocytes (
×
10
9
cells/l)
2.05 (1.62–2.54)
2.18 (1.80–2.90)
0.002
ELR
0.11 (0.06–0.17)
0.08 (0.05–0.12)
<
0.0001
Haemoglobin (g/dl)
14.4 (13.6–15.1)
14.1 (13.5–15.0)
0.09
Haematocrit (%)
43.1 (41.0–45.5)
42.0 (41.0–45.0)
0.07
White blood cells
(
×
10
9
cells/l)
8.11
±
1.75
7.49
±
1.80
<
0.0001
#
Urea (mg/dl)
30.0 (25.0–36.0)
29.2 (23.7–35.0)
0.10
Creatinine (mg/dl)
0.67 (0.54–0.78)
0.66 (0.55–0.77)
0.50
Sodium (mmol/l)
140.0 (138.0–142.0) 140.0 (138.0–142.0)
0.36
Potassium (meq/l)
4.3 (4.0–4.6)
4.3 (4.1–4.6)
0.40
Calcium (mg/dl)
9.21
±
0.49
9.27
±
0.47
0.23
#
CAE: coronary artery ectasia; NCA: normal coronary arteries; LDL-C: low-
density lipoprotein cholesterol; HDL-C: high-density lipoprotein cholesterol;
ELR: eosinophil-to-lymphocyte ratio.
#
Normality of the distribution was evaluated by the Kolmogorov–Smirnov test,
and the Mann–Whitney
U-
test was applied to compare for continous variables
except for white blood cells and calcium.
Table 2. Eosinophil and lymphocyte counts and
ELR values according to vessel count
Vessels
Noun
Eosinophil count
(
×
10
9
cells/l)
Lymphocyte count
(
×
10
9
cells/l)
ELR value
One vessel
135
0.22
±
0.12
2.23
±
0.81
0.11
±
0.07
Two vessels
42
0.26
±
0.14
2.05
±
0.59
0.14
±
0.10
Three vessels
55
0.24
±
0.12
1.96
±
0.79
0.14
±
0.09
All
p
-values for eosinophil and lymphocyte counts
>
0.5.
p-
value for ELR (between one and three vessels): 0.04.
Table 3. Eosinophil and lymphocyte counts and
ELR values according to the Markis classification
Markis
classification
Noun (%) Eosinophil count
(
×
10
9
cells/l)
Lymphocyte count
(
×
10
9
cells/l)
ELR value
Type I
51 (21.98)
0.25
±
0.12
1.93
±
0.79
0.15
±
0.10
Type II
38 (16.38)
0.24
±
0.12
1.98
±
0.60
0.14
±
0.09
Type III
41 (17.67)
0.21
±
0.13
2.15
±
0.94
0.11
±
0.07
Type IV 102 (43.96)
0.23
±
0.13
2.29
±
0.73
0.11
±
0.08
All
p
-values for eosinophil and lymphocyte counts
>
0.5.
p-
value for ELR (between Markis type I and IV): 0.04.
Group
Isolated CAE: 0.11 (0.06–0.17)
NCA: 0.08 (0.05–0.12)
ELR
0.40
0.35
0.30
0.25
0.20
0.15
0.10
0.05
0.00
p
< 0.0001
Fig. 6.
Comparison of ELR between isolated CAE and NCA.