


 12 / 64

CARDIOVASCULAR JOURNAL OF AFRICA • Volume 31, No 5, September/October 2020
232
AFRICA
No significant correlations were observed between eosinophil
count and any Markis classification (
p
=
0.314,
r
=
–0.066) or
between eosinophil count and diffuse ectasia (
p
=
0.544,
r
=
0.040) (Table 5). Likewise, there was no correlation between
eosinophil count and vessel count (
p
=
0.103,
r
=
0.107) (Table
5). However, the ELR significantly correlated with the Markis
classification and diffuse ectasia and vessel count (
p
=
0.005,
r
=
–0.182;
p
=
0.027,
r
=
0.145;
p
=
0.005,
r
=
0.185, respectively), and
the lymphocyte count significantly correlated with the Markis
classification and diffuse ectasia (
p
=
0.001,
r
=
0.211;
p
=
0.001,
r
=
–0.211, respectively) (Table 5).
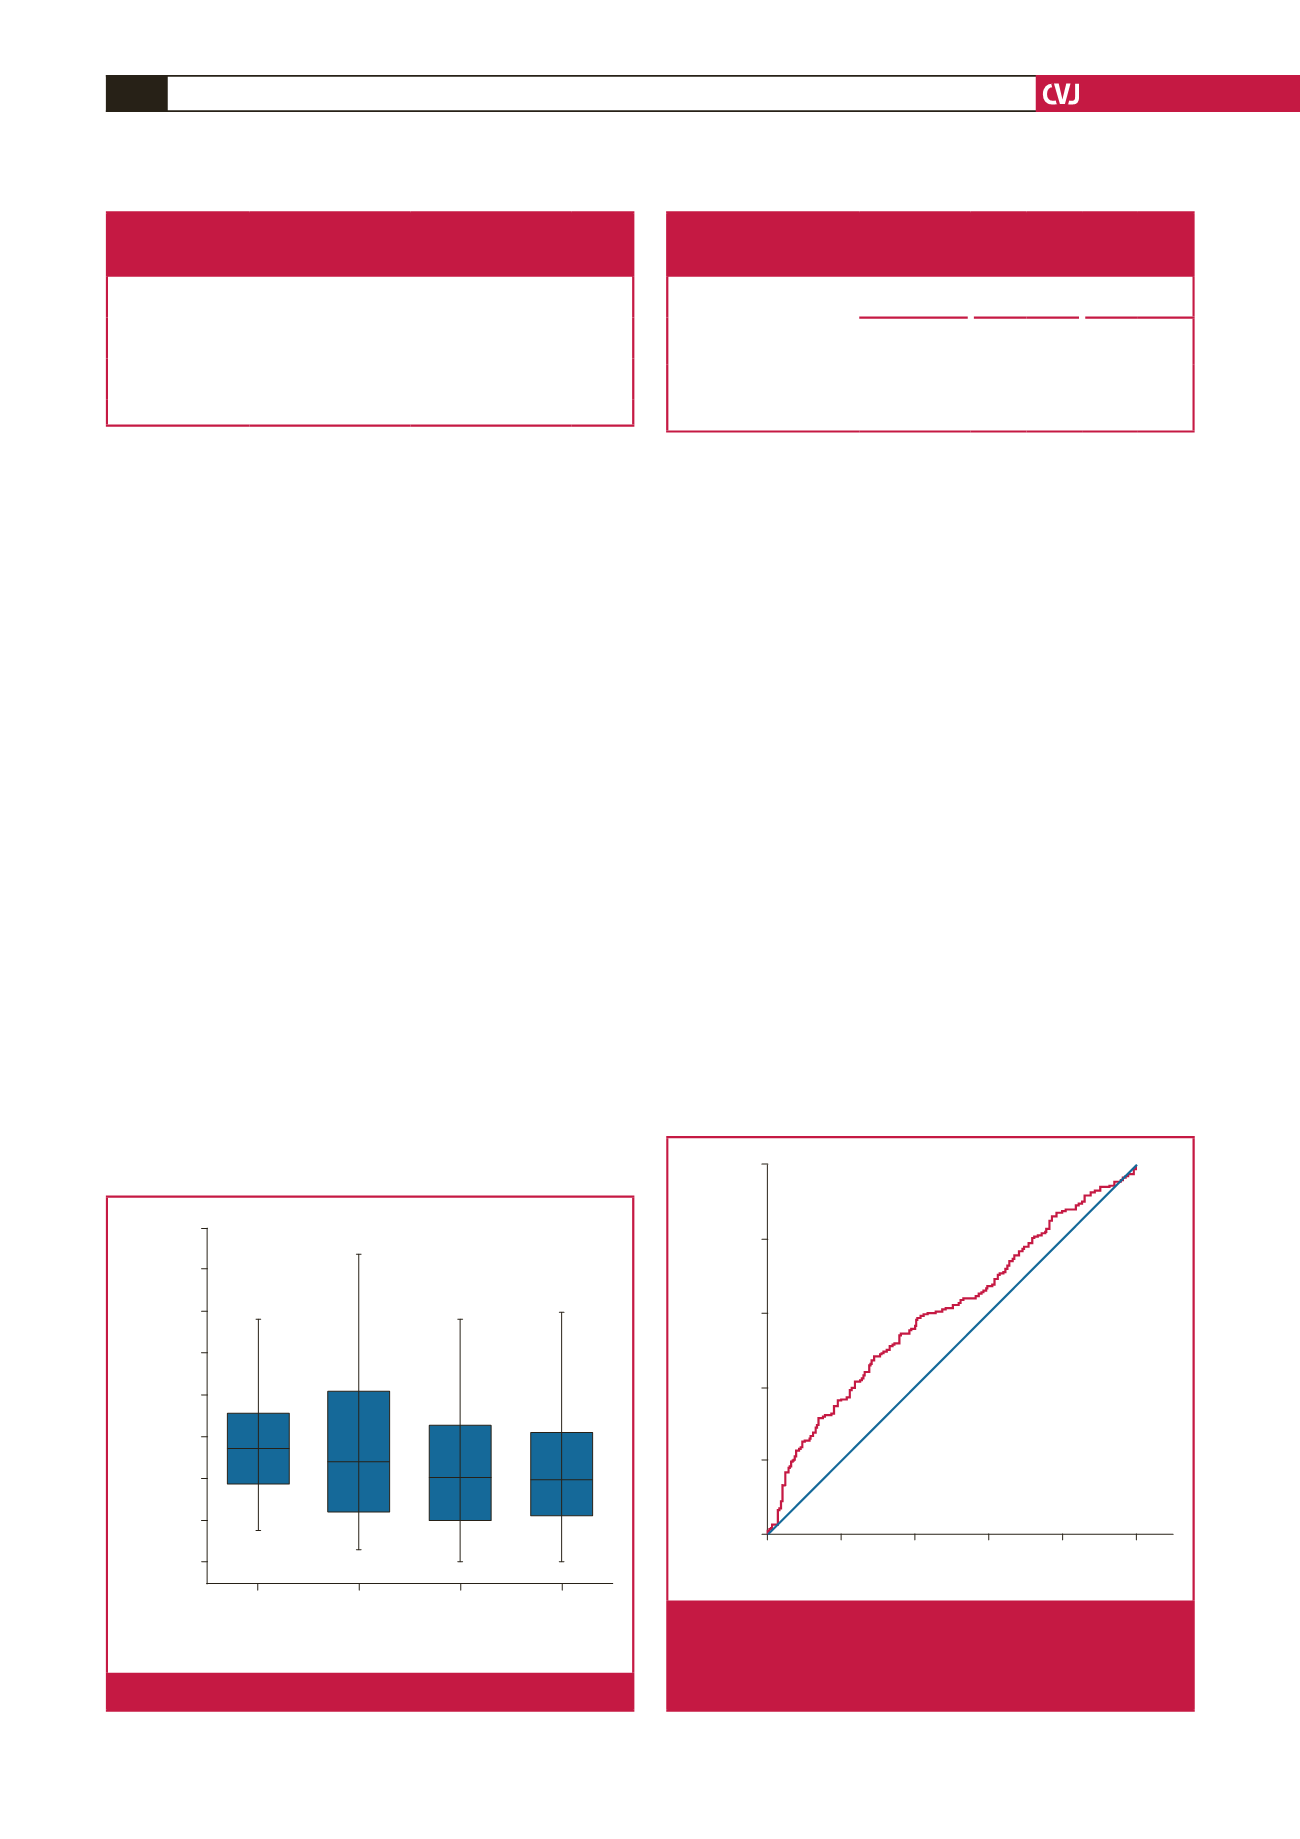
ROC curve analysis revealed that the specificity of an ELR >
0.099 (measured before coronary angiography) in predicting
isolated CAE was 60.3%, and the sensitivity was 56.5% [area
under the curve (AUC): 0.604, 95% CI: 0.553, 0.655;
p
<
0.0001)
(Fig. 8). No differences were observed between the two groups
with regard to other analysed laboratory data (Table 1).
Discussion
The analysis revealed that ELR, and eosinophil and WBC
counts were significantly higher in the isolated CAE group
compared to the NCA group. However, HDL-C levels and
lymphocyte counts were significantly lower for the isolated CAE
group than for the NCA group (Table 1). In addition, the study
revealed no relationship between eosinophil count and number
of ectatic vessels, the diffuseness of the ectatic segment and
Markis classification. However, it was found that ELR values
were significantly related to the stated classifications.
Coronary artery ectasia may be acquired or congenital.
24-28
The associated diseases reported in its aetiology are 50%
atherosclerosis, 20–30% congenital diseases and 10–20%
inflammatory or connective tissue diseases.
6
The association
between inflammation and CAE has been revealed using well-
recognised inflammatory markers such as WBC, neutrophil and
monocyte counts, and interleukin-6, matrix metalloproteinase,
tumour necrosis factor-
α
and C-reactive protein (CRP) levels.
29,30
The ischaemic mechanism in patients with CAE has not been
fully understood. However, it is accepted that the leading cause
of ischaemia and angina is impaired microvascular perfusion.
Slow or turbulent flow in dilated vessels has been reported to
cause ischaemia by causing thrombosis in the ectatic segment
and embolism in the distal coronary artery.
3
Eosinophils are
loaded with many granule-associated molecules that cause
vascular thrombosis and endothelial damage. Major basic
protein and eosinophil peroxidase, as the most well-known of
these granules, are also platelet agonists and play an important
role in thrombus formation.
20
Eosinophils may additionally cause
thrombosis by secreting tissue factor and stimulating platelets
and leukocytes, in addition to secreting major basic protein and
eosinophil peroxidase.
20,31
These three proteins (tissue factor, basic protein and eosinophil
peroxidase) contribute considerably to thrombus formation
by stimulating thrombocytes and inhibiting thrombomodulin.
Table 4. Comparison of ELR values, and eosinophil and
lymphocyte counts between focal (Markis type IV)
and diffuse ectasia (Markis type I, II, III)
Counts
Focal ectasia
(
n
=
102)
Diffuse ectasia
(
n
=
130)
p-
value
Eosinophil count
(
×
10
9
cells/l)
0.20 (0.12–0.32)
0.22 (0.14–0.33)
0.54
Lymphocyte count
(
×
10
9
cells/l)
2.21 (1.81–2.67)
1.93 (1.55–2.36)
0.001
ELR
0.10 (0.05–0.15)
0.12 (0.06–0.18)
0.02
Table 5. Spearman’s correlation analysis between vessel count,
extension of isolated CAE and Markis classification,
and eosinophil and lymphocyte counts and ELR value.
Eosinophil
count
Lymphocyte
count
ELR
value
r
p
r
p
r
p
Vessel count
0.107 0.103 –0.127 0.052 0.185 0.005
Extension of isolated CAE
(as diffuse)
0.040 0.544 –0.211 0.001 0.145 0.027
Markis classification
–0.066 0.314 0.211 0.001 –0.182 0.005
Markis
Type I:
0.15
±
0.10
Type II:
0.14
±
0.09
Type III:
0.11
±
0.07
Type IV:
0.11
±
0.08
ELR
0.40
0.35
0.30
0.25
0.20
0.15
0.10
0.05
0.00
p
(Between type I and type IV): 0.04
All other
p
-values > 0.5
Fig. 7.
Comparison of ELR among Markis type I, II, III and IV.
1 – Specificity
0.0
0.2
0.4
0.6
0.8
1.0
Sensitivity
1.0
0.8
0.6
0.4
0.2
0.0
AUC: 0.604, 95% CI 0.553, 0.655;
p
< 0.0001;
specifity: 60.3; sensitivity: 56.5; cut off > 0.099
Fig. 8.
ELR ROC analysis between isolated CAE and NCA.
AUC: area under the curve; CI: confidence interval;
ELR: eosinophil-to-lymphocyte ratio; ROC: receiver
operating characteristics.