


 46 / 61

CARDIOVASCULAR JOURNAL OF AFRICA • Volume 32, No 4, July/August 2021
218
AFRICA
six reports on stroke
46-51
) were included in the meta-analysis.
Studies on this subject (Table 1) were published over 12 years
(1995–2017). Most reports assessed GLV intakes using the food-
frequency questionnaire, but limited studies
42,45,50
adjusted for
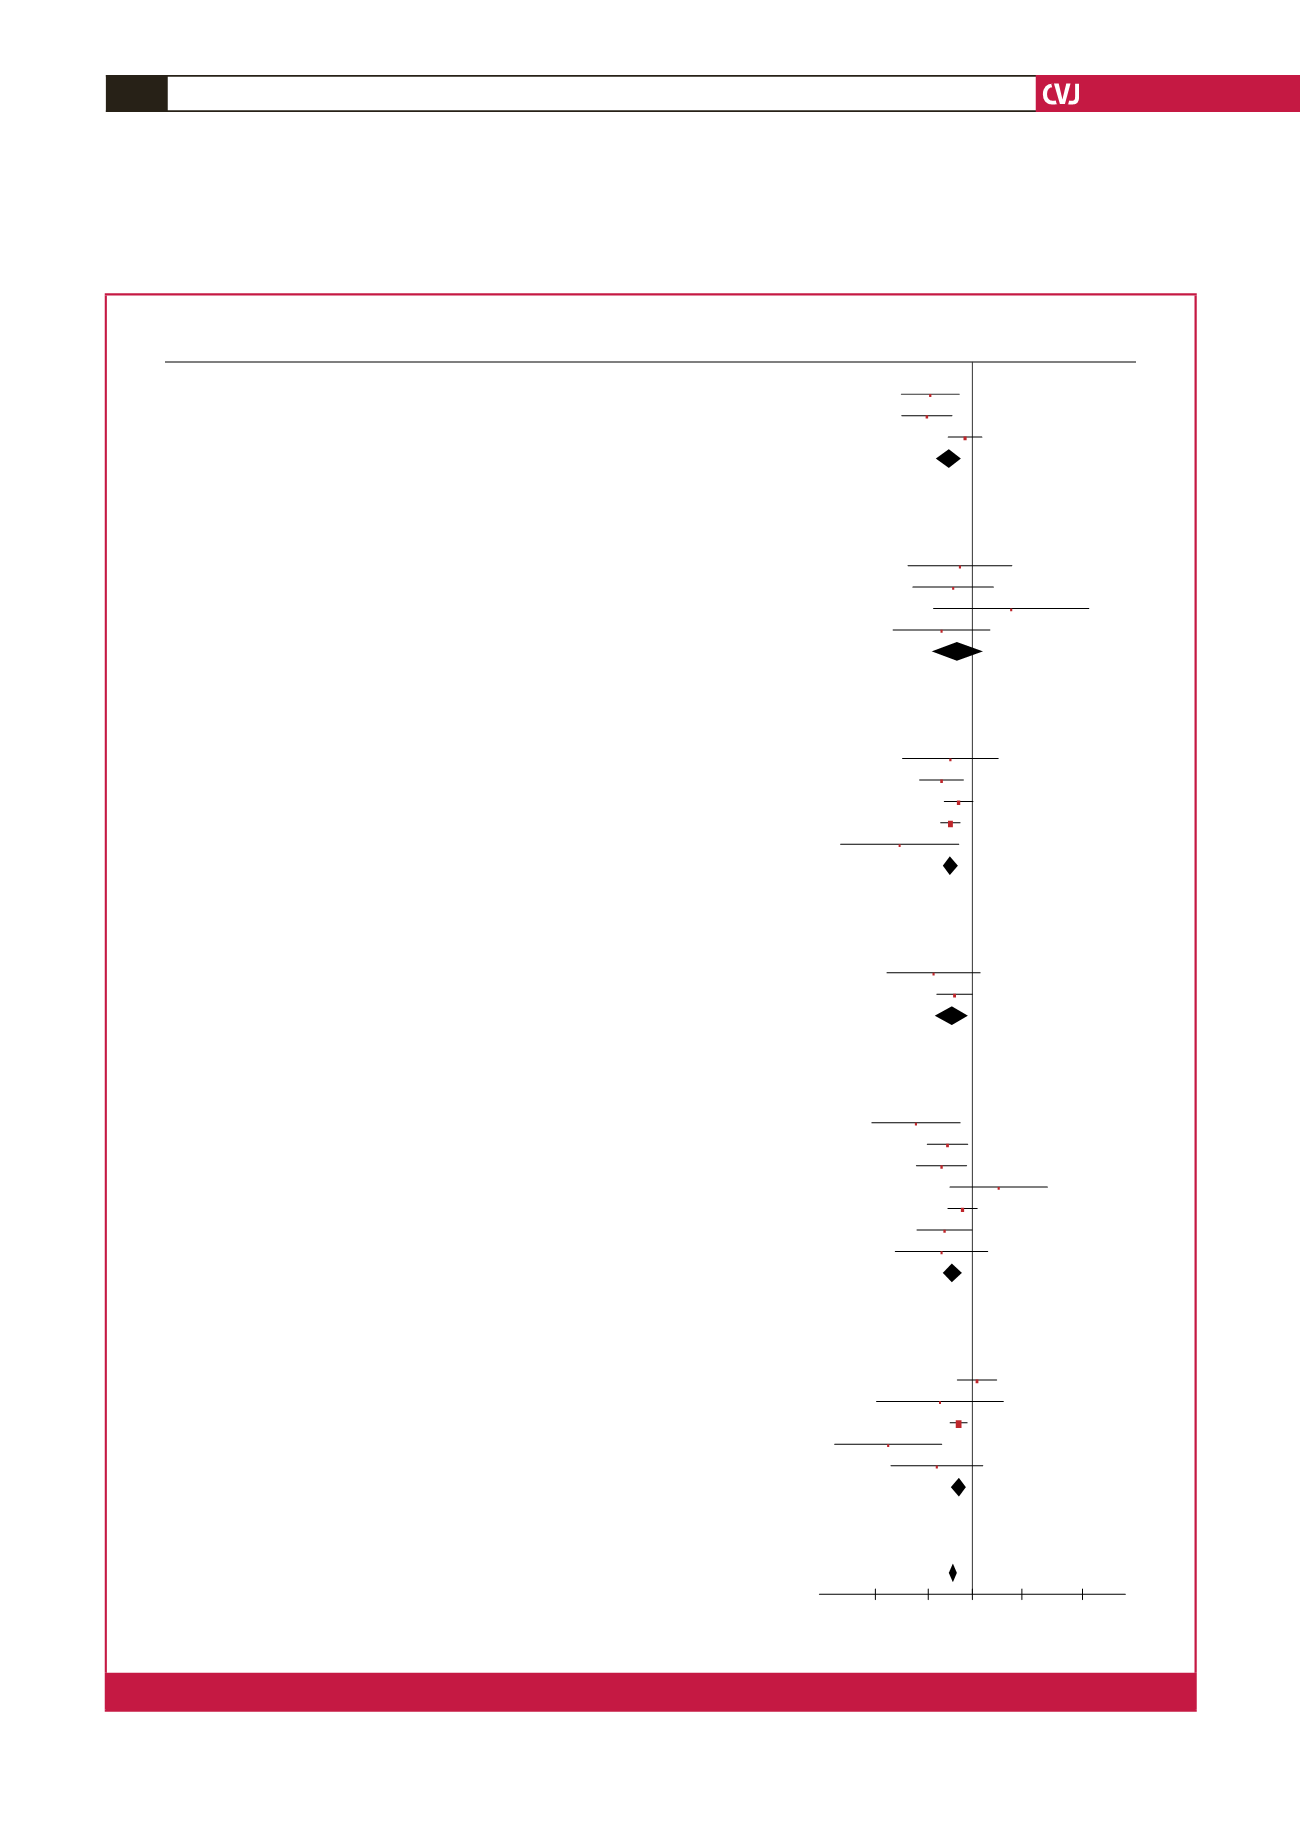
Study or Subgroup
1.1.1 Cerebral Infarction only
Sauvaget et al 2003_Cerebral Infarction_women only
Sauvaget et al 2003_Cerebral Infarction_men only
Larsson et al 2013_Cerebral Infarction
Subtotal (95% CI)
Heterogeneity: Chi² = 8.01, df = 2 (P = 0.02); I² = 75%
Test for overall effect: Z = 3.65 (P = 0.0003)
1.1.2 Cerebal&Subarachnoid Haemorrhage only
Sauvaget et al 2003_Cerebral Haemorrhage_men only
Sauvaget et al 2003_Cerebral Haemorrhag_women only
Larsson et al 2013_Subarachnoid haemorrhage
Larsson et al 2013_Cerebral Haemorrhage
Subtotal (95% CI)
Heterogeneity: Chi² = 2.30, df = 3 (P = 0.51); I² = 0%
Test for overall effect: Z = 1.14 (P = 0.25)
1.1.3 Coronary Heart Disease only
Oude Griep et al 2011_CHD
Joshipura et al 2001_CHD
Blekkenhorst et al 2017_CHD
Bhupathiraju et al 2013_CHD
Bendinelli et al 2010_CHD
Subtotal (95% CI)
Heterogeneity: Chi² = 4.67, df = 4 (P = 0.32); I² = 14%
Test for overall effect: Z = 5.66 (P < 0.00001)
1.1.4 Heart Disease only
Wang et al 2016_Heart Disease
R autiainen et al 2014_Heart failure
Subtotal (95% CI)
Heterogeneity: Chi² = 0.68, df = 1 (P = 0.41); I² = 0%
Test for overall effect: Z = 2.41 (P = 0.02)
1.1.5 Stroke only
Wang et al 2016_Stroke
Sauvaget et al 2003_Stroke_women only
Sauvaget et al 2003_Stroke_men only
Oude Griep et al 2011_all Stroke
Larsson et al 2013_all Stroke
Joshipura et al 1999_Ischemic Stroke
Johnsen et al 2003_Ischemic Stroke
Subtotal (95% CI)
Heterogeneity: Chi² = 9.33, df = 6 (P = 0.16); I² = 36%
Test for overall effect: Z = 4.11 (P < 0.0001)
1.1.6 Composite CVD events
Takachi et al 2007_all CVD
Joshipura et al 2008_Ischemic CVD
Hung et al 2004_all CVD
Gaziano et al 1995_all CVD
Buil-Cosiales et al 2016_all CVD
Subtotal (95% CI)
Heterogeneity: Chi² = 11.12, df = 4 (P = 0.03); I² = 64%
Test for overall effect: Z = 3.42 (P = 0.0006)
Total (95% CI)
Heterogeneity: Chi² = 39.36, df = 25 (P = 0.03); I² = 36%
Test for overall effect: Z = 8.82 (P < 0.00001)
Test for subgroup differences: Chi² = 3.27, df = 5 (P = 0.66), I² = 0%
log[Risk Ratio]
-0.15490196
-0.16749109
-0.02687215
-0.04575749
-0.07058107
0.1430148
-0.11350928
-0.08092191
-0.11350928
-0.05060999
-0.08092191
-0.26760624
-0.1426675
-0.06550155
-0.20760831
-0.09151498
-0.11350928
0.09691001
-0.03621217
-0.10237291
-0.11350928
0.01703334
-0.11918641
-0.05060999
-0.30980392
-0.13076828
SE
0.05456118
0.04727855
0.03187213
0.09762756
0.07586625
0.14602545
0.09104281
0.09006607
0.04140382
0.02721793
0.01850782
0.11115525
0.08777159
0.03335925
0.08305432
0.03820467
0.04727855
0.09175396
0.0276909
0.05184783
0.08696467
0.03709756
0.11918641
0.0161207
0.10079822
0.08634094
Weight
2.1%
2.7%
6.0%
10.8%
0.6%
1.1%
0.3%
0.7%
2.7%
0.8%
3.6%
8.2%
17.8%
0.5%
30.9%
0.8%
5.5%
6.3%
0.9%
4.2%
2.7%
0.7%
8.0%
2.3%
0.8%
19.6%
4.4%
0.4%
23.5%
0.6%
0.8%
29.8%
100.0%
IV, Fixed, 95% CI
0.86 [0.77, 0.95]
0.85 [0.77, 0.93]
0.97 [0.91, 1.04]
0.92 [0.88, 0.96]
0.96 [0.79, 1.16]
0.93 [0.80, 1.08]
1.15 [0.87, 1.54]
0.89 [0.75, 1.07]
0.95 [0.86, 1.04]
0.92 [0.77, 1.10]
0.89 [0.82, 0.97]
0.95 [0.90, 1.00]
0.92 [0.89, 0.96]
0.77 [0.62, 0.95]
0.92 [0.90, 0.95]
0.87 [0.73, 1.03]
0.94 [0.88, 1.00]
0.93 [0.87, 0.99]
0.81 [0.69, 0.96]
0.91 [0.85, 0.98]
0.89 [0.81, 0.98]
1.10 [0.92, 1.32]
0.96 [0.91, 1.02]
0.90 [0.82, 1.00]
0.89 [0.75, 1.06]
0.93 [0.90, 0.96]
1.02 [0.95, 1.09]
0.89 [0.70, 1.12]
0.95 [0.92, 0.98]
0.73 [0.60, 0.89]
0.88 [0.74, 1.04]
0.95 [0.93, 0.98]
0.93 [0.92, 0.95]
Risk Ratio
Risk Ratio
IV, Fixed, 95% CI
0.7
0.85 1
1.2
1.5
Favours [experimental] Favours [control]
Fig. 2.
Relative risk, 95% CI and
p
-value of incidence of all CVD events in the meta-analysis.