


 48 / 61

CARDIOVASCULAR JOURNAL OF AFRICA • Volume 32, No 4, July/August 2021
220
AFRICA
0.89–0.95;
p <
0.00001).
Statistical heterogeneity (Fig. 1) was low for studies on heart
disease only (
I
2
= 0%), CHD only (
I
2
= 14%), and stroke only (
I
2
= 36%) but not among studies on cerebral infarction only (
I
2
=
75%).
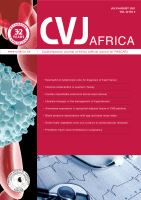
Funnel plots (Figs 3B, 4) suggested no evidence of publication
bias and no sole study exerted a significant effect on the sensitivity
of the overall findings of the meta-analysis (Tables 3, 4).
Discussion
In this study, higher intake of GLV was linked to reduced
incidence of all CVD events by 7% and, in particular, it was
inversely related to the incidence of cerebral infarction, CHD,
heart disease and stroke. These findings may suggest a potential
role of GLV intake as a primary-prevention strategy in the
management of CVD.
Similar to our findings, the largest study on stroke among
Africans [the Stroke Investigative Research and Educational
Network (SIREN) study] reported a strong protective dose–
response association such that daily consumption of GLV was
more protective against stroke [odds ratio (OR): 0.27; 95% CI:
0.19–0.38] than weekly consumption (OR: 0.70; 95% CI: 0.52–
0.95), compared to no consumption.
52
Earlier systematic reviews
and meta-analyses were broadly focused and generally combined
fruit and vegetables in investigating the effect of these nutritional
modalities on incident CVD events.
11,19,20,22,53-58
The uniqueness
of our study is therefore in the deconstruction of the specific
contribution of GLV on CVD. Also, our approach offered vital
insights into the potential roles of GLV in the occurrence of
CVD subtypes.
Although the exact mechanism of the protective effect of
GLV is not well understood, some constituents of GLV are likely
to confer small-to-moderate but clinically important protection
against CVD.
25
For example, VitaminB
9
, micronutrients and other
Table 3. Sensitivity analysis of pooled RR stratified
by categories of CVD events in the meta-analysis
Studies in the meta-analysis
I
2
(%)
Pooled RR
(95% CI)
p
-value
All studies
36 0.93 (0.92–0.95) < 0.00001
Cerebral infarction only
28 0.94 (0.92–0.95) < 0.00001
Cerebal and subarachnoid haemor-
rhage only
43 0.93 (0.92–0.95) < 0.00001
Coronary heart disease only
41 0.94 (0.92–0.96) < 0.00001
Heart disease only
40 0.93 (0.92–0.95) < 0.00001
Stroke only
40 0.93 (0.92–0.95) < 0.00001
Composite CVD events
22 0.93 (0.91–0.94) < 0.00001
Table 4. Sensitivity analysis of pooled RR of all
cohort studies included in the meta-analysis
Studies in the meta-analysis
I
2
(%)
Pooled RR
(95% CI)
p
-value
Cerebral infarction only
All studies
75 0.92 (0.88–0.96)
0.0003
Larsson
et al
. 2013_Cerebral infarction 0 0.85 (0.79–0.91) < 0.00001
Sauvaget
et al
. 2003_Cerebral infarc-
tion_men only
76 0.94 (0.89–0.99)
0.03
Sauvaget
et al
. 2003_Cerebral infarc-
tion_women only
84 0.93 (0.88–0.98)
0.007
Cerebal and subarachnoid haemorrhage
only
All studies
0 0.95 (0.86–1.04)
0.25
Larsson
et al
. 2013_Cerebral haemor-
rhage
0 0.97 (0.87–1.08)
0.57
Larsson
et al
. 2013_Subarachnoid
haemorrhage
0 0.93 (0.84–1.02)
0.12
Sauvaget
et al
. 2003_Cerebral haemor-
rhage_women only
0 0.96 (0.85–1.08)
0.48
Sauvaget
et al
. 2003_Cerebral haemor-
rhage_men only
13 0.95 (0.85–1.05)
0.30
Coronary heart disease only
All studies
14 0.92 (0.90–0.95) < 0.00001
Bendinelli
et al
. 2010_CHD
0 0.93 (0.90–0.95) < 0.00001
Bhupathiraju
et al
. 2013_CHD
36 0.93 (0.89–0.97)
0.0003
Blekkenhorst
et al.
2017_CHD
4 0.91 (0.88–0.94) < 0.00001
Joshipura
et al.
2001_CHD
23 0.93 (0.90–0.96) < 0.00001
Oude Griep
et al
. 2011_CHD
36 0.92 (0.90–0.95) < 0.00001
Heart disease only
All studies
0 0.93 (0.87–0.99)
0.02
Rautiainen
et al
. 2014_Heart failure
– 0.87 (0.73–1.03)
0.10
Wang
et al
. 2016_Heart disease
– 0.94 (0.88–1.00)
0.05
Stroke only
All studies
36 0.93 (0.90–0.96) < 0.0001
Johnsen
et al
. 2003_Ischemic stroke
45 0.93 (0.90–0.97) < 0.0001
Joshipura
et al
. 1999_Ischemic stroke
44 0.93 (0.90–0.97)
0.0003
Larsson
et al
. 2013_all stroke
22 0.91 (0.87–0.95) < 0.0001
Oude Griep
et al
. 2011_all stroke
14 0.92 (0.89–0.96) < 0.0001
Sauvaget
et al
. 2003_Stroke_men only 41 0.94 (0.90–0.97)
0.0005
Sauvaget
et al
. 2003_Stroke_women
only
45 0.93 (0.90–0.97)
0.0007
Wang
et al
. 2016_Stroke
24 0.94 (0.90–0.97)
0.0003
Composite CVD events
All studies
64 0.95 (0.93–0.98)
0.0006
Buil-Cosiales
et al
. 2016_all CVD 75 0.95 (0.93–0.98)
0.001
Gaziano
et al
. 1995_all CVD
30 0.96 (0.93–0.98)
0.003
Hung
et al
. 2004_all CVD
73 0.96 (0.90–1.02)
0.17
Joshipura
et al
. 2008_Ischemic CVD 72 0.95 (0.93–0.98)
0.0009
Takachi
et al.
2007_all CVD
59 0.94 (0.91–0.97) < 0.0001
Subgroups
Cerebral Infarction only
Cerebal&Subarachnoid Haemorrhage only
Coronary Heart Disease only
Heart Disease only
Stroke only
Composite CVD events
0.7
0.85
1
1.2
1.5
0
0.05
0.1
0.15
0.2
RR
SE(log[RR])
Fig. 4.
Funnel plots assessing publication bias in the meta-
analysis.