
CARDIOVASCULAR JOURNAL OF AFRICA • Volume 32, No 4, July/August 2021
AFRICA
219
total energy intakes (and other dietary confounding factors) in
the multivariate analysis of GLV and CVD outcomes.
More than half of the studies included in this report presented
a low risk of bias (Table 2). In all, methodological assessment of
included reports revealed no evidence of high risk of bias in most
studies included in the meta-analysis.
Overall, higher intake of GLV (Fig. 2) was associated with
reduced incidence of all CVD events by 7% (RR: 0.93; 95%
CI: 0.92–0.95;
p
< 0.00001). Similarly, higher GLV intake was
inversely related to the incidence of cerebral infarction (RR:
0.92; 95% CI: 0.88–0.96;
p =
0.0003), CHD (RR: 0.92; 95%
CI: 0.90–0.95;
p <
0.00001), heart disease (RR: 0.93; 95% CI:
0.87–0.99;
p =
0.02) and stroke (RR: 0.93; 95% CI: 0.90–0.96;
p <
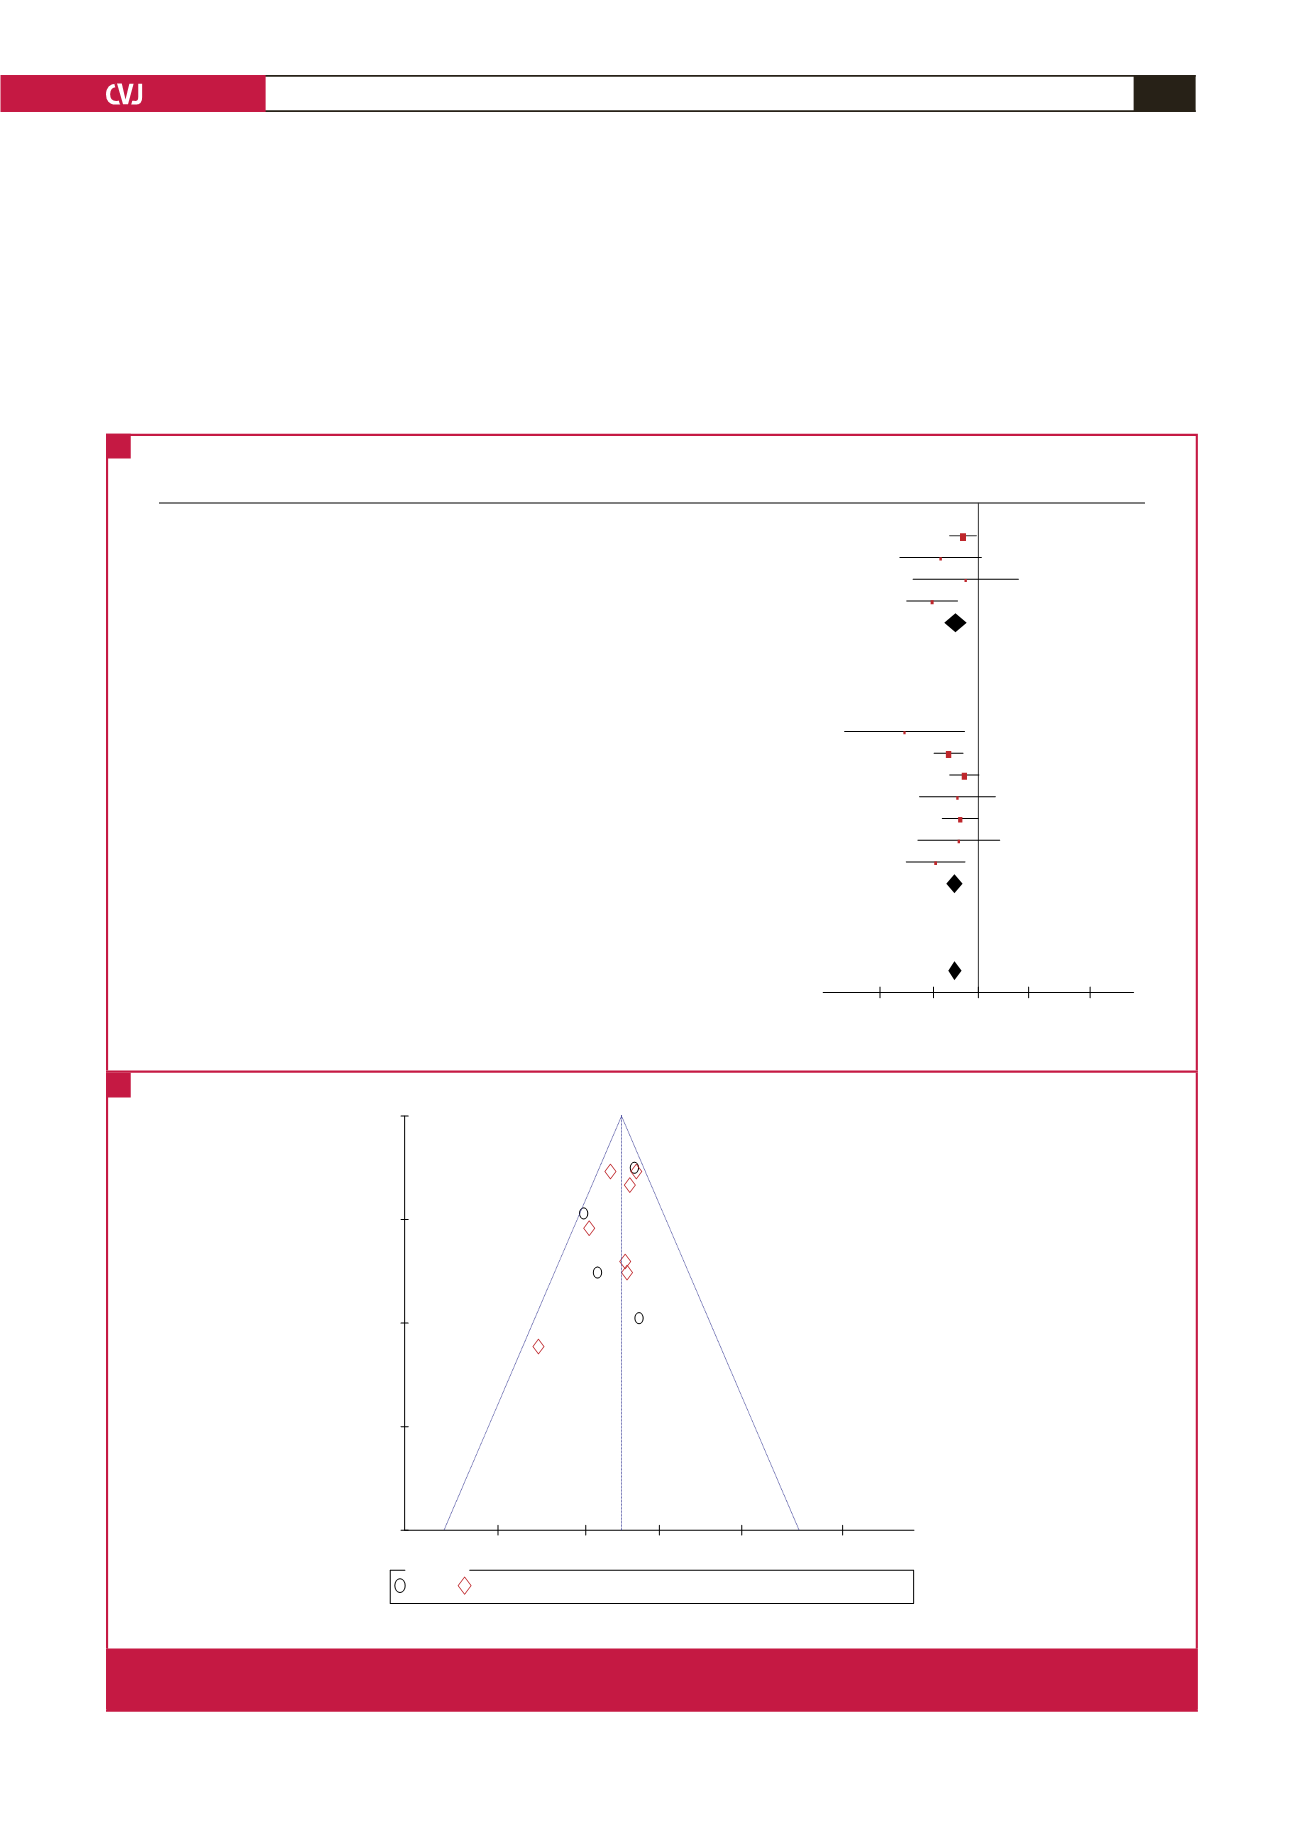
0.0001). The result remained unchanged after stratifying
the studies by gender of respondents (Fig. 3A); men (RR: 0.92;
95% CI: 0.88–0.96;
p <
0.0001) and women (RR: 0.92; 95% CI:
Study or Subgroup
1.2.1 Men
Bhupathiraju et al 2013_CHD_men only
Joshipura et al 1999_Ischemic Stroke_men only
Sauvaget et al 2003_Cerebral Haemorrhage_men only
Sauvaget et al 2003_Cerebral Infarction_men only
Subtotal (95% CI)
Heterogeneity: Chi² = 5.05, df = 3 (P = 0.17); I² = 41%
Test for overall effect: Z = 3.99 (P < 0.0001)
1.2.2 Women
Bendinelli et al 2010_CHD
Bhupathiraju et al 2013_CHD_women only
Blekkenhorst et al 2017_CHD
Joshipura et al 1999_Ischemic Stroke_women only
R autiainen et al 2014_Heart failure
Sauvaget et al 2003_Cerebral Haemorrhag_women only
Sauvaget et al 2003_Cerebral Infarction_women only
Subtotal (95% CI)
Heterogeneity: Chi² = 7.05, df = 6 (P = 0.32); I² = 15%
Test for overall effect: Z = 5.67 (P < 0.00001)
Total (95% CI)
Heterogeneity: Chi² = 12.11, df = 10 (P = 0.28); I² = 17%
Test for overall effect: Z = 6.93 (P < 0.00001)
Test for subgroup differences: Chi² = 0.01, df = 1 (P = 0.92), I² = 0%
log[Risk Ratio]
-0.05551733
-0.13667714
-0.04575749
-0.16749109
-0.26760624
-0.1079054
-0.05060999
-0.07572071
-0.06550155
-0.07058107
-0.15490196
SE
0.02500207
0.07572293
0.09762756
0.04727855
0.11115525
0.02694734
0.02721793
0.07024694
0.03335925
0.07586625
0.05456118
Weight
23.7%
2.6%
1.6%
6.6%
34.5%
1.2%
20.4%
20.0%
3.0%
13.3%
2.6%
5.0%
65.5%
100.0%
IV, Fixed, 95% CI
0.95 [0.90, 0.99]
0.87 [0.75, 1.01]
0.96 [0.79, 1.16]
0.85 [0.77, 0.93]
0.92 [0.88, 0.96]
0.77 [0.62, 0.95]
0.90 [0.85, 0.95]
0.95 [0.90, 1.00]
0.93 [0.81, 1.06]
0.94 [0.88, 1.00]
0.93 [0.80, 1.08]
0.86 [0.77, 0.95]
0.92 [0.89, 0.95]
0.92 [0.90, 0.94]
Risk Ratio
Risk Ratio
IV, Fixed, 95% CI
0.7
0.85 1
1.2
1.5
Favours [experimental] Favours [control]
Subgroups
Men
Women
0.7
0.85
1
1.2
1.5
0
0.05
0.1
0.15
0.2
RR
SE(log[RR])
Fig. 3.
Relative risk, 95% CI and
p-
value of incidence (A) and funnel plot (B) of all CVD events stratified by gender in the meta-
analysis.
A
B


