CARDIOVASCULAR JOURNAL OF AFRICA • Vol 23, No 5, June 2012
AFRICA
277
The mean procedure, fluoroscopy and ablation times were
220.6
±
89.6 min, 31.0
±
20.4 min, and 61.3
±
28.1 min,
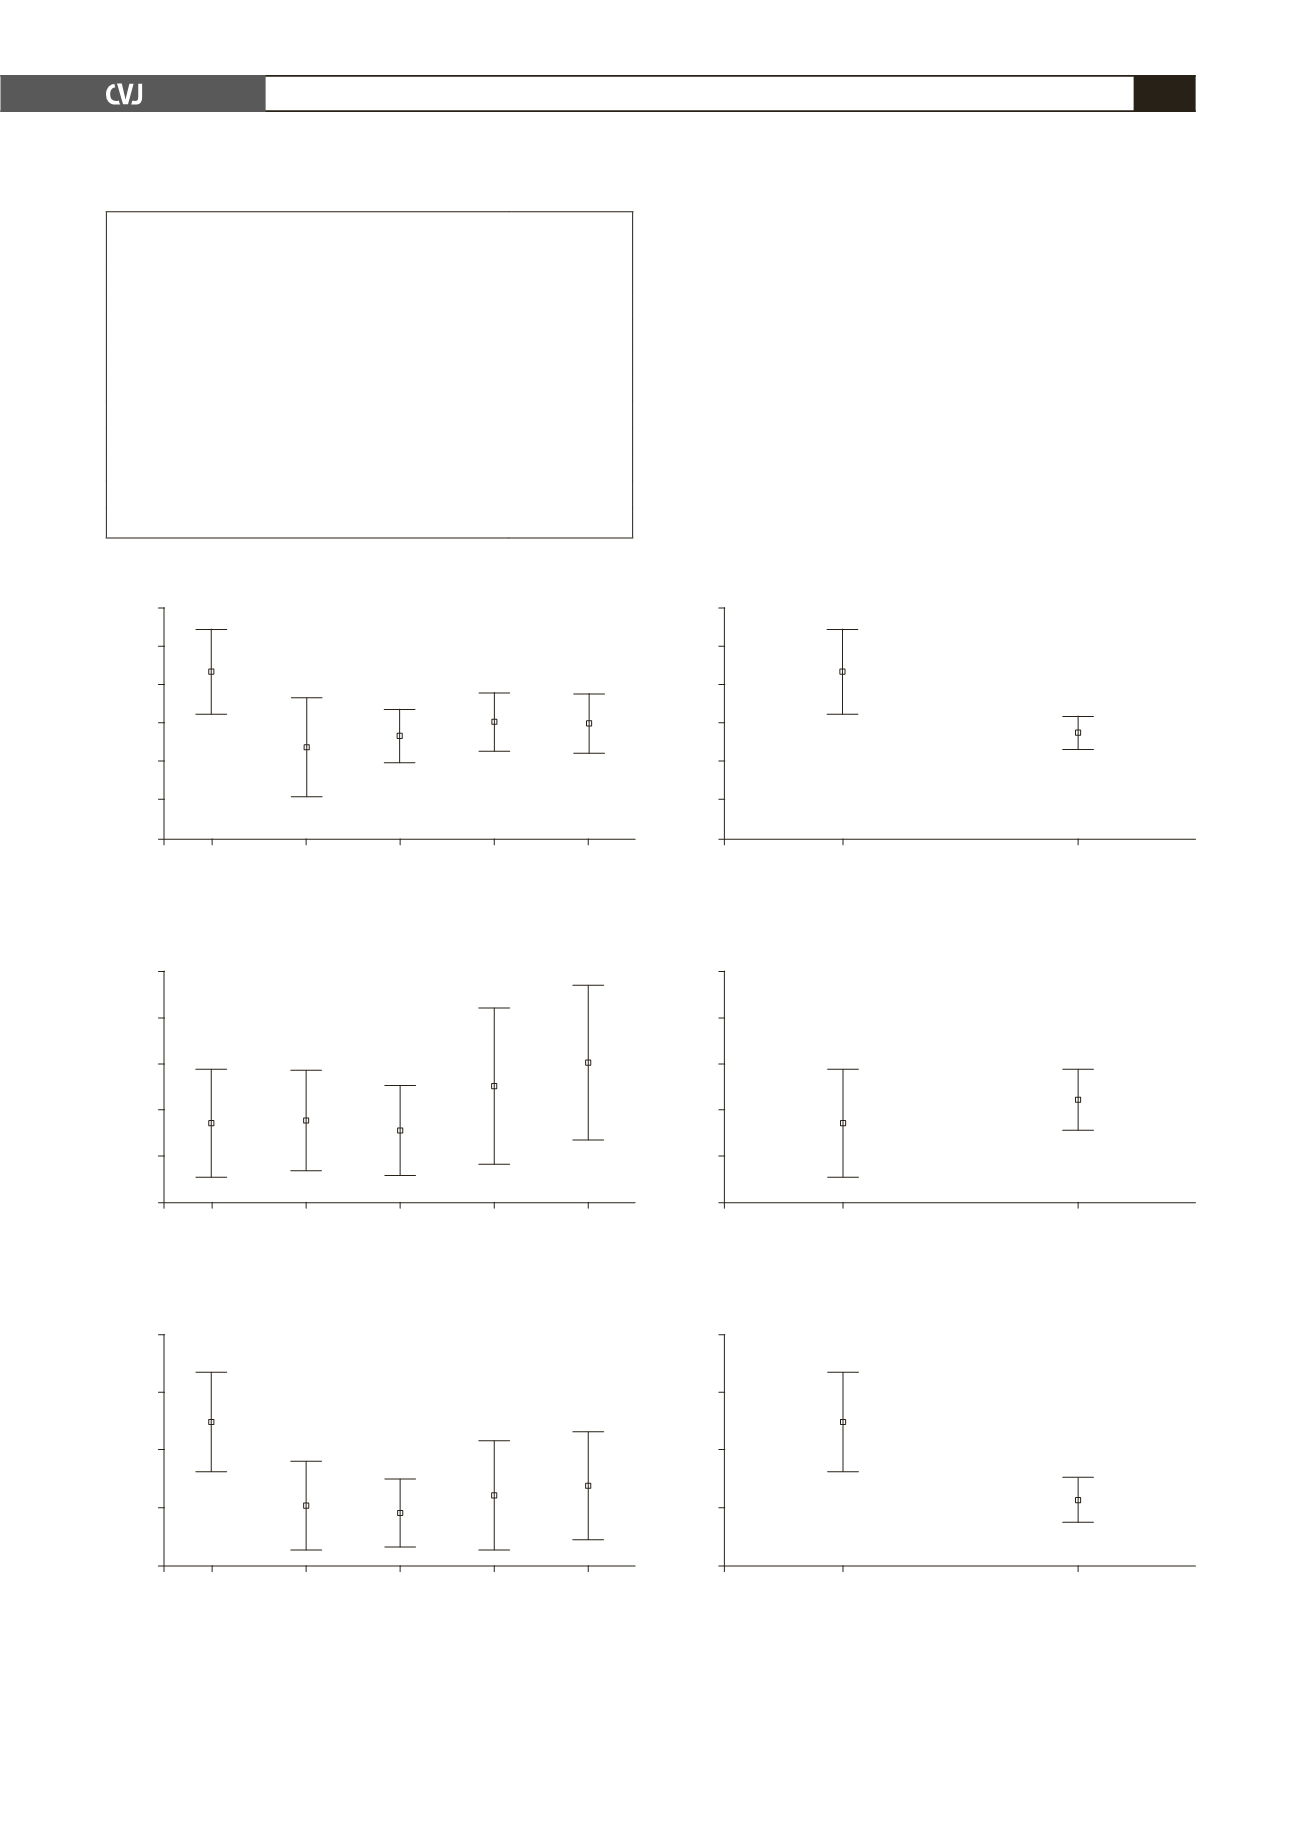
respectively. Both fluoroscopy (screening) and procedure times
were significantly longer for the first 19 patients compared
with the remaining 76 patients (43.5
±
22.7 vs 27.8
±
18.5 min,
p
=
0.002 and 274.7
±
90.2 vs 207.1
±
84.7 mins,
p
=
0.002,
respectively), whereas ablation time did not change significantly
as the number of performed procedures increased (ANOVA
p
=
0.455) (Fig. 1).
Fluoroscopy time showed a significant decrescendo trend for
the first half of the patients, with an
R
2
of 0.25 and
p
=
0.006 (Fig.
2). There was no significant correlation for the second half of the
procedures (
p
=
0.619).
60
50
40
30
20
10
0
60
50
40
30
20
10
0
90
80
70
60
50
40
90
80
70
60
50
40
350
300
250
200
150
350
300
250
200
150
95% CI screening time (min)
95% CI screening time (min)
95% CI radiofrequency time (min)
95% CI radiofrequency time (min)
95% CI procedure time (min)
95% CI procedure time (min)
1st
2nd
3rd
4th
5th
First 19 patients
Rest
1st
2nd
3rd
4th
5th
First 19 patients
Rest
1st
2nd
3rd
4th
5th
First 19 patients
Rest
Subgroups of 19 patients
First fifth vs rest of the patients
Subgroups of 19 patients
First fifth vs rest of the patients
Subgroups of 19 patients
Subgroups of 19 patients
Fig. 1. Error bars representing screening time, radiofrequency time and procedure time for subgroups of 19 patients;
CI, confidence interval.
TABLE 2. TYPES OF DYSRHYTHMIA IN THE STUDY
POPULATION
Dysrhythmia
n (%)
Atrial fibrillation
95 (100)
paroxysmal
13 (14)
persistent
77 (81)
long-standing persistent
5 (5)
Atrial flutter
35 (37)
typical
29 (31)
atypical
2 (2)
left atrial
3 (3)
peri-mitral
1 (1)


