CARDIOVASCULAR JOURNAL OF AFRICA • Vol 24, No 8, September 2013
310
AFRICA
The intima–media thickness was greater than 1 mm in 9%
of patients with just tooth fillings, significantly lower than the
ratio for patients with decayed and missing teeth (
p
=
0.0001).
The number of missing teeth was significantly associated with
the baseline degree of carotid artery intima–media thickness.
Toothless patients also had a significantly higher baseline degree
of thickness (
p
=
0.007).
In group II, patients who were completely toothless (11%)
and had a dental prosthesis were included as a separate category
in the calculations of the SLI. Analysing these patients, we found
that toothless patients had a significantly higher risk for disease
progression compared to patients in group I (
p
=
0.001).
The hsCRP values were significantly higher in group II than
in group I both at baseline and after six months (
p
=
0. 001).
The hsCRP levels were higher than 3 mg/l in 8% of patients in
group I, and in 92% of patients in group II. The mean levels of
fibrinogen were minimally higher in group II than in group I
but the difference was not statistically significance (
p
=
0.06).
Both DMFT and SLI indices were significantly associated with
hsCRP levels at baseline and the six-month follow up. Among
patients who received treatment, the intima–media thickness
was similar after six months but the hsCRP and fibrinogen levels
were significantly lower (
p
=
0.001).
During a mean of 6.2 months (4.1–8.6 months), no deaths
were recorded. During the follow-up period, only three patients
TABLE 1. DEMOGRAPHICAND CLINICAL DATA
OF THE STUDY PATIENTS
Parameters
Group I,
n
=
125
(DMFT: 0–3,
SLI: 0–1)
Group II,
n
=
425
(DMFT: 4–28,
SLI: 2–3)
p
-value
Age (mean
±
SD)
48.75
±
9.72 50.15
±
9.80 0.160
Males,
n
(%)
74 (59.2)
262 (61.64) 0.766
BMI (kg/m
2
) (mean
±
SD)
27
±
4
28
±
6
0.08
Systolic blood pressure (mmHg)
(mean
±
SD)
136
±
21
139
±
24 0.207
Diastolic blood pressure (mmHg)
(mean
±
SD)
79
±
12
78
±
16
0.51
Family history,
n
(%)
23 (18.4%)
85 (20%)
0.713
Fasting plasma glucose (mg/dl)
(mean
±
SD)
92
±
12
94
±
15 0.172
Total cholesterol (mg/dl)
(mean
±
SD)
204
±
28
212
±
32 0.012
Triglycerides (mg/dl) (mean
±
SD) 185
±
18
187
±
22 0.35
Uric acid (mg/dl) (mean
±
SD)
5.1
±
2.2
5.2
±
2.6 0.69
DMFT index (mean
±
SD)
1.1
±
4.56 19.82
±
6.44 0.001
Mean SLI (mean
±
SD)
0.56
±
2.32 2.76
±
3.42 0.001
Mean CA IMT (mm) (mean
±
SD) 0.63
±
0.1 1.79
±
0.14 0.001
HsCRP (mg/l) (mean
±
SD)
2.8
±
3.4
4.7 ± 3.8 0,001
Fibrinogen (g/l) (mean
±
SD)
2.9
±
4.2
4.1 ± 4.4 0.06
Mean
±
SD; mean
±
standard deviation; BMI, body mass index; DMFT,
decayed, missing, filled teeth; SLI, Silness-Loe plaque index; CA IMT,
carotid artery intima–media thickness; HsCRP, high-sensitivity C-reactive
protein.
TABLE 2. CAROTIDAND POPLITEALARTERIAL
ULTRASOUND RESULTSANDACUTE-PHASE REACTANT
LEVELS IN TWO GROUPS OF PATIENTS
Group I,
n
=
125
(DMFT: 0–3,
SLI: 0–1)
Group II,
n
=
425
(DMFT: 4–28,
SLI: 2–3)
p-value
Beginning
n (%)
n (%)
Carotid intima–media thickness
1–2 mm
15 (12)
349 (82.12) 0.0001
>
2 mm
2 (1.6)
76 (17.88)
0.0001
Popliteal artery
1–2 mm
9 (7.2)
238 (56)
0.0001
>
2 mm
3 (2.4)
183 (43)
0.0001
HsCRP (
≤
3 mg/l)
10 (8)
391 (92)
0.0001
Fibrinogen (
≤
5 g/l)
9 (7.2)
36 (8.3)
0.09
After six months
Carotid intima–media thickness
1–2 mm
18 (14.4)
369 (86.82)
0.001
>
2 mm
3 (2.4)
204 (48)
0.0001
Popliteal artery
1–2 mm
11 (8.8)
259 (60.94) 0.0001
>
2 mm
3 (2.4)
208 (48.94) 0.0001
HsCRP (
≤
3 mg/l)
5 (4)
315 (74.11) 0.0001
Fibrinogen (
≤
5 g/l)
6 (4.8)
26 (6.11)
0.06
DMFT, decayed, missing, filled teeth; SLI, Silness-Loe plaque index;
HsCRP, high-sensitivity C-reactive protein.
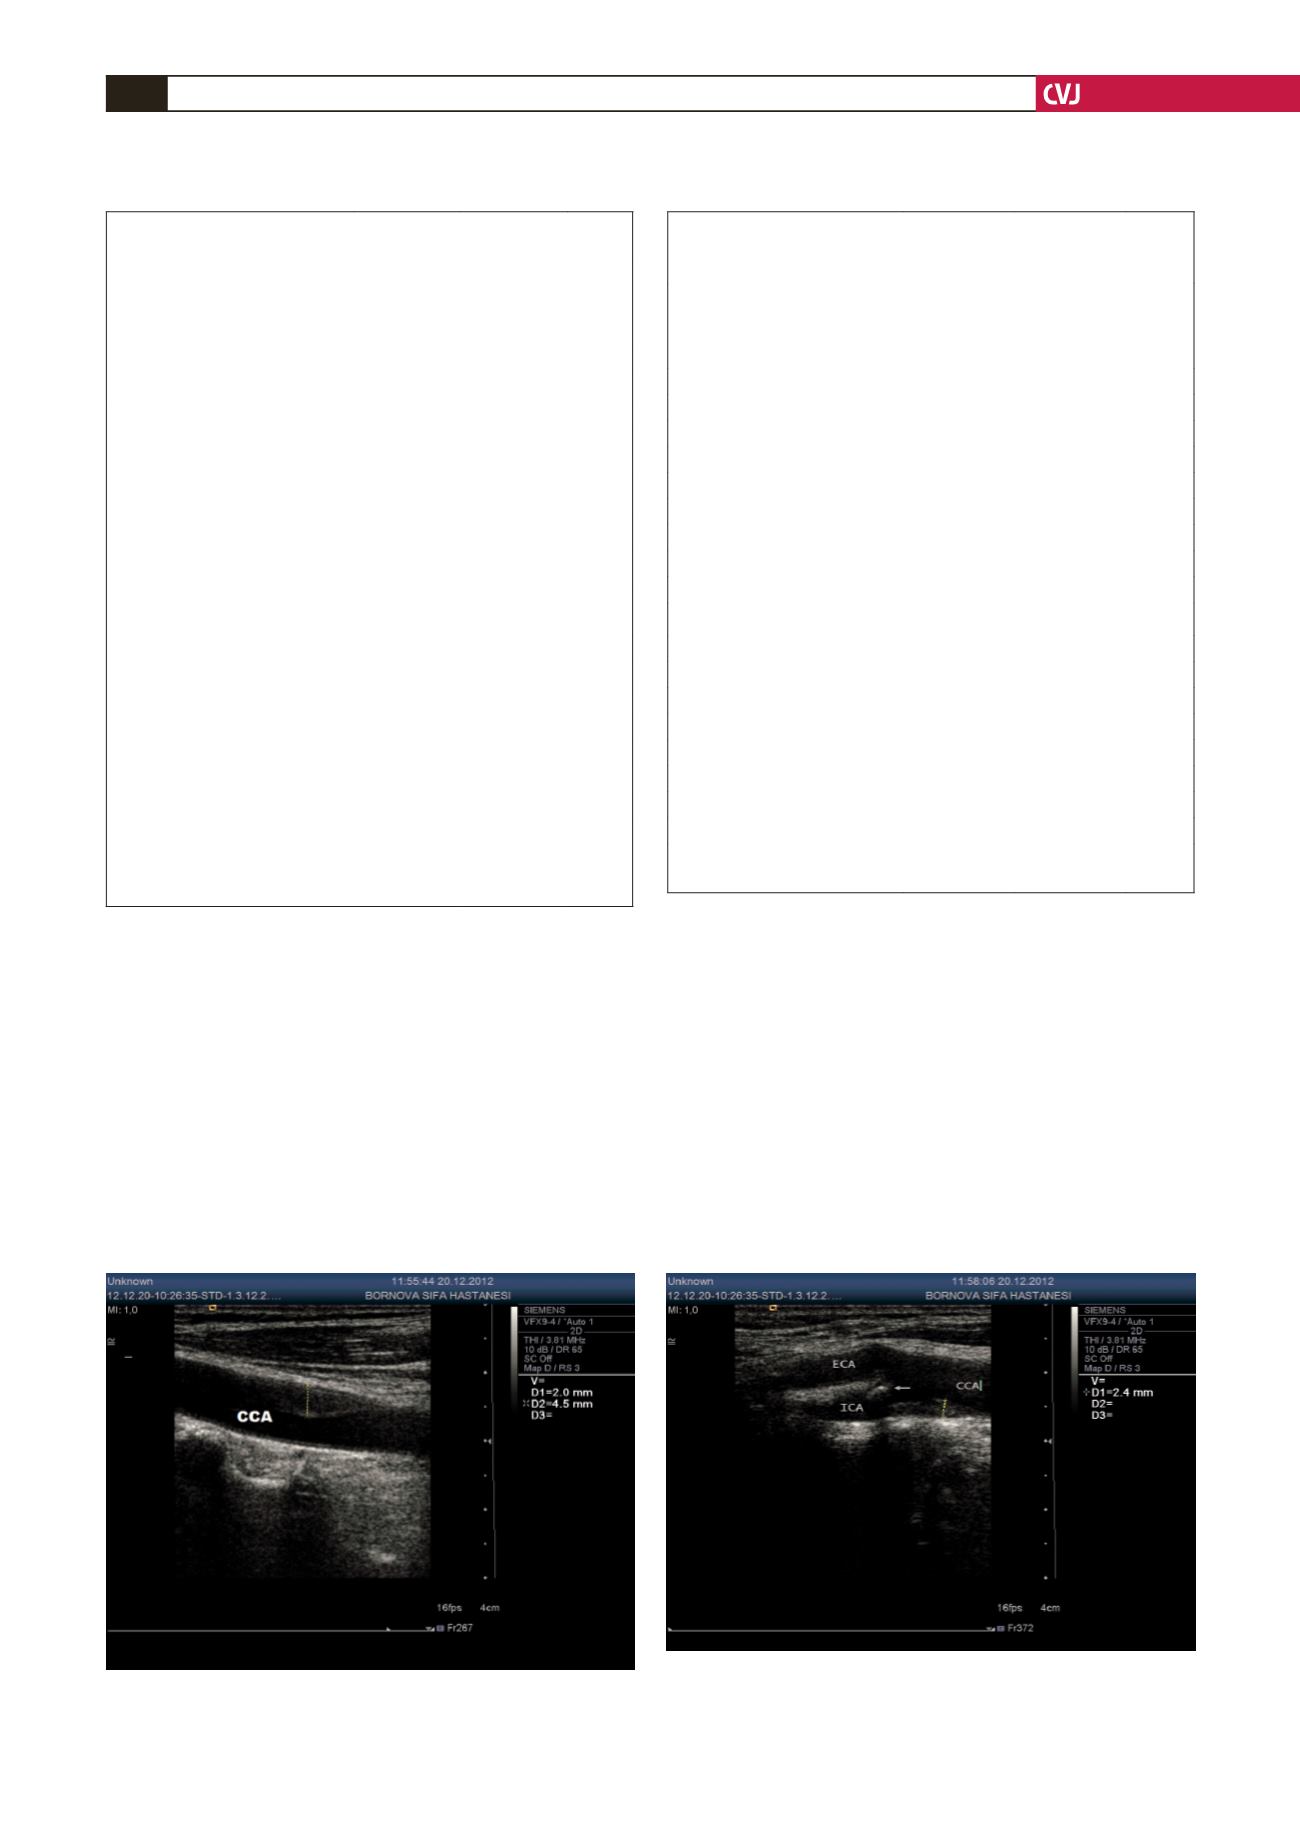
Fig. 1. Carotid artery intima–media thickness measured
with B-mode ultrasonography.
Fig. 2. The intima–media thickness is seen in the bifurca-
tion of the carotid artery, measured with B-mode ultra-
sonography.


