


 79 / 84

CARDIOVASCULAR JOURNAL OF AFRICA • Volume 29, No 2, March/April 2018
AFRICA
e9
current pregnancy included CCS class II angina and NYHA
grade III dyspnoea. In addition, she had a past history of
hypercholesterolaemia.
Her initial electrocardiogram revealed poor R amplitude and
T-wave inversion globally, and Q waves in the inferolateral leads
(Fig. 2). A transthoracic echocardiogram revealed a dilated left
ventricle and impaired LV function with an ejection fraction
of 38%, and multiple regional hypokinesia with no evidence of
LV mural thrombus. A repeat coronary angiogram performed
after delivery revealed normal epicardial coronary arteries with
severely impaired LV contractility, with an estimated LV ejection
fraction of 35% and a large LV apical (mural) thrombus. The
patient delivered a 3.09 kg healthy female baby by an elective
caesarean section after 34 weeks of pregnancy. There were no
intra-operative or postoperative complications reported.
With subsequent follow up, her heart failure had worsened and
a repeat transthoracic echocardiography revealed deterioration
in her LV function, due to poor compliance. Her anti-failure
therapy was optimised and her condition improved dramatically,
however she was lost to follow up.
Patient 3 was a 34-year-old female of Indian descent who
presented to her local hospital at 33 weeks of gestation with an
acute anterior ST-elevation myocardial infarction. However, the
patient was referred to the tertiary hospital at least 24 hours after
her initial presentation to her local hospital. In addition, there
was a documented history of an acute myocardial infarction a
year earlier. Her risk factors for CAD included diabetes mellitus
and hypertension.
Her initial electrocardiogram revealed extensive ST elevations
in the anterior leads. A repeat electrocardiogram on arrival at
Fig. 1.
Electrocardiogram of patient 1 in sinus rhythm show-
ing an isolated T-wave inversion and poor R amplitude
in lead III.
Fig. 2.
Electrocardiogram of patient 2 showing sinus rhythm,
poor R amplitude and T-wave inversions globally, with
a left-axis deviation.
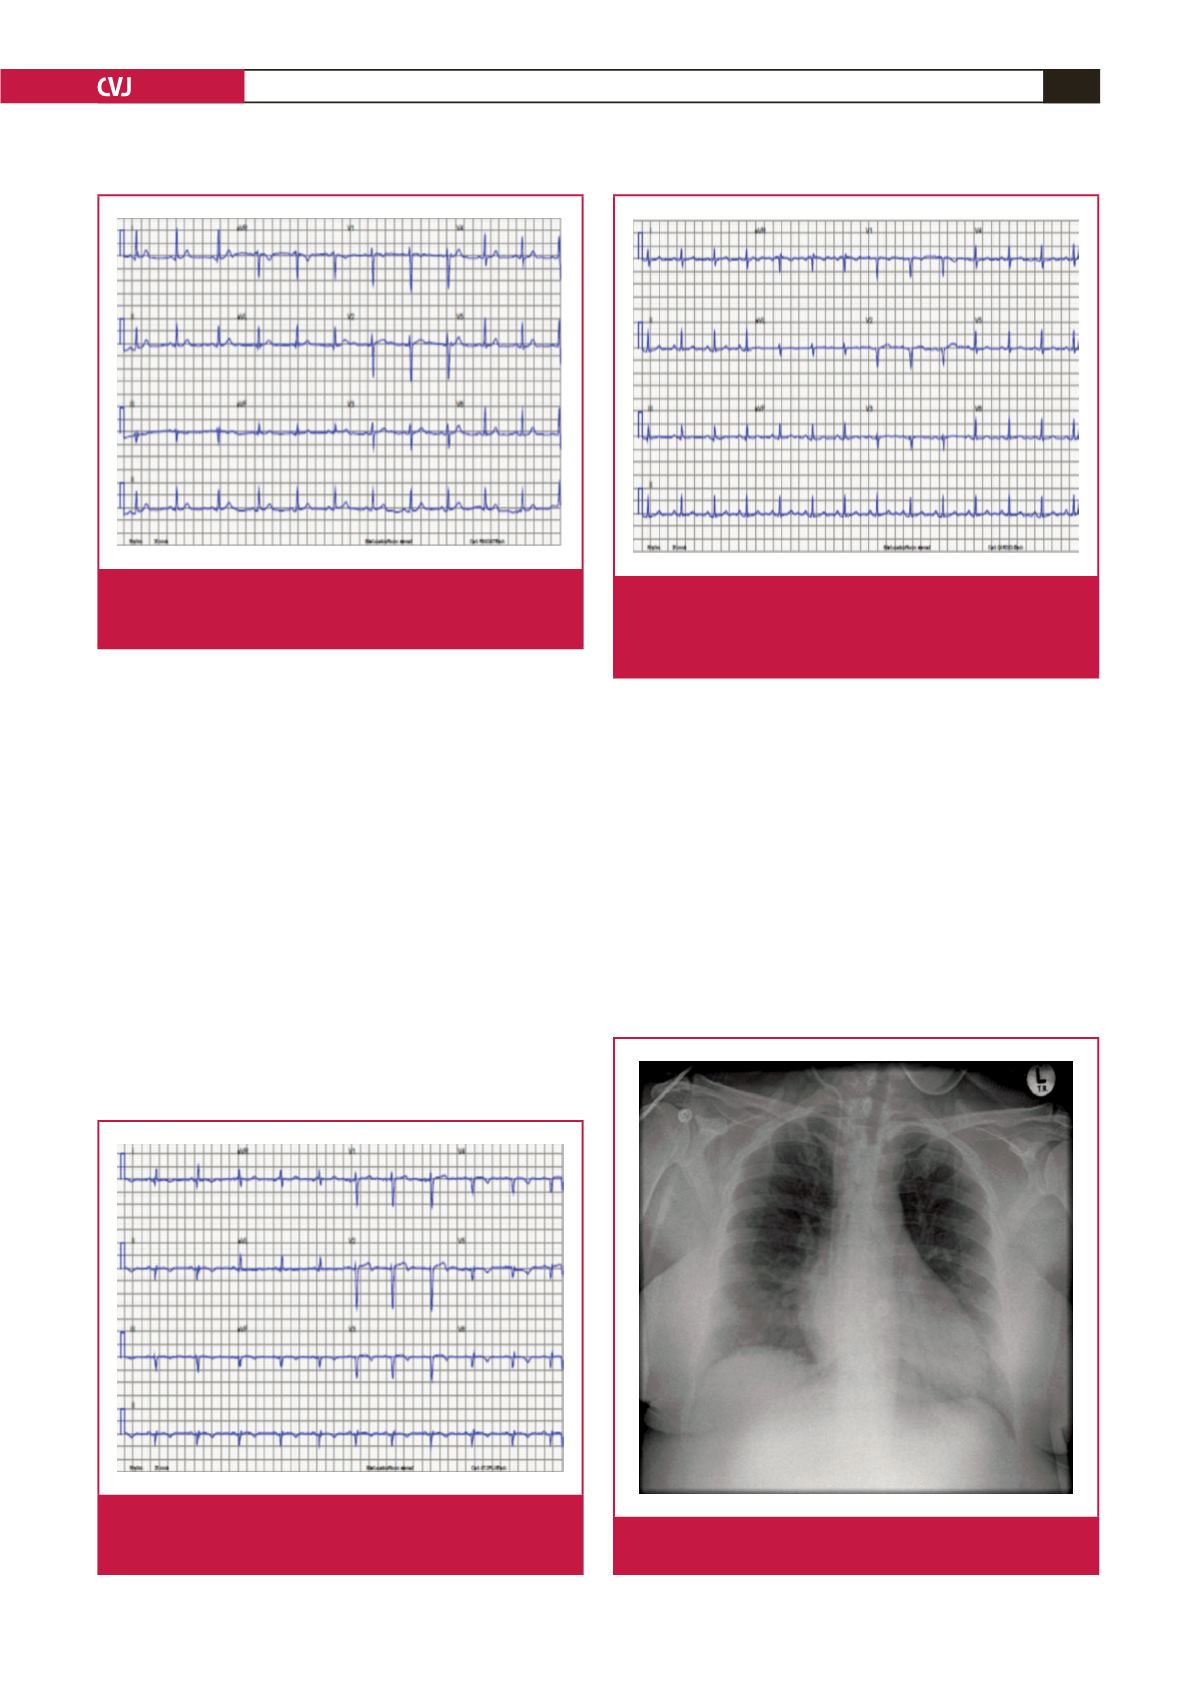
Fig. 3.
Electrocardiogram of patient 3 at least 24 hours
after the myocardial infarction, in sinus rhythm with
Q waves in leads V1–V2 (poor R-wave amplitude in
leads V1–V3).
Fig. 4.
Chest X-ray of patient 3 showing a mildly increased
cardiothoracic ratio and clear lung fields.