


 42 / 66

CARDIOVASCULAR JOURNAL OF AFRICA • Volume 32, No 3, May/June 2021
152
AFRICA
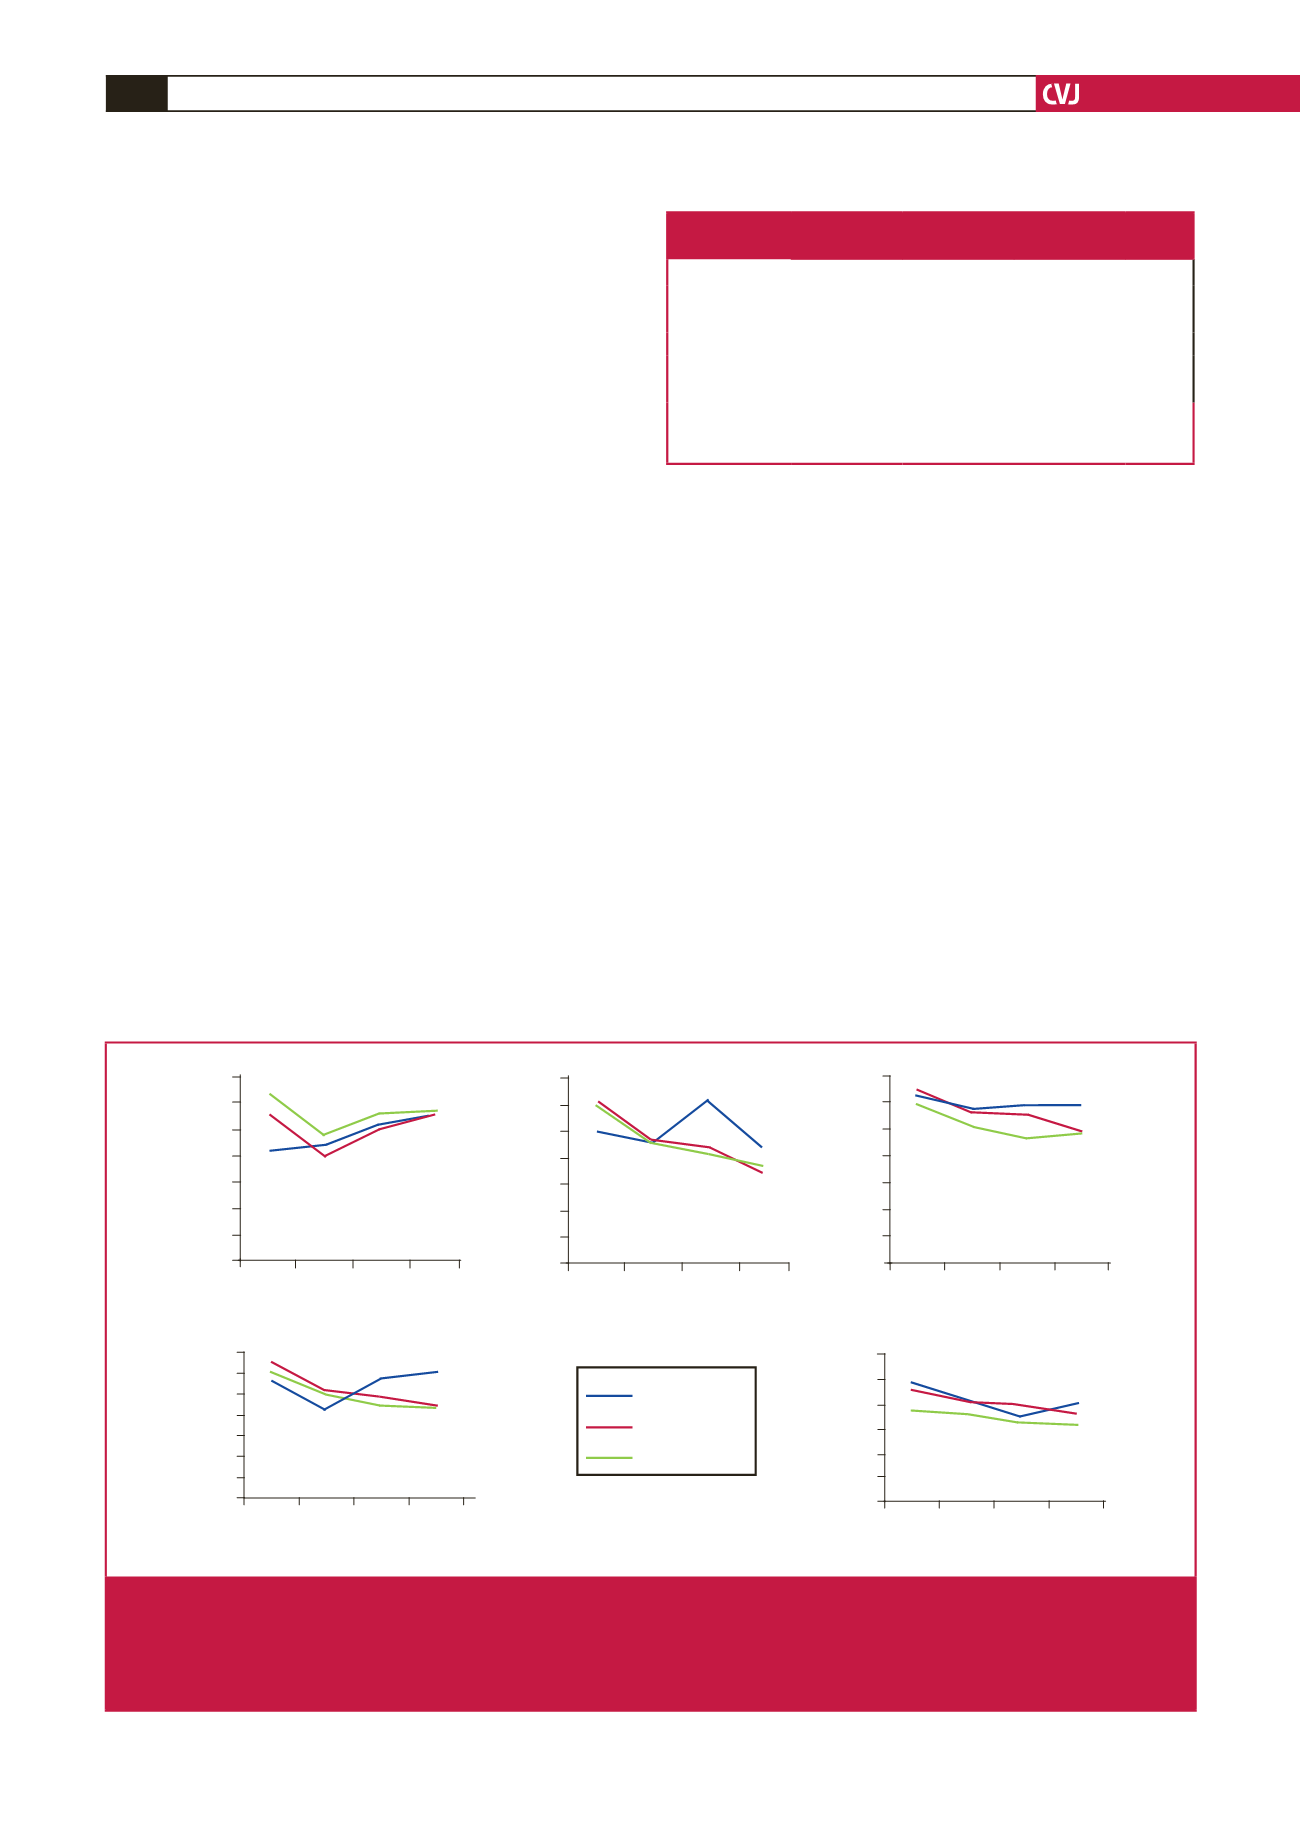
(Fig. 1). Of significance, most of the recovery in LV function and
chamber dimensions was complete at six weeks in the group with
a pre-operative EF > 60%, while the PA pressure continued to
fall, and normalised at six months (Table 4, Fig. 1).
After feeding all clinical and echocardiographic variables into
a predictive model, only ESD emerged as a significant predictor
of postoperative LV dysfunction (EF < 50%), both on univariate
(OR 0.9, 95% CI: 0.8–0.9,
p
= 0.04) and multivariate analysis
(OR 0.8, 95% CI: 0.7–0.9,
p
= 0.04).
Paired analysis was conducted on 83 subjects with complete
datasets for all time points. The median pre-operative EF in
this paired sample was 63% (IQR 58–70%) (Table 5). At two
weeks post MVR, there was a 20% decrease in EF (median
46%, IQR 38–55) (
p
< 0.001), followed by a significant increase
at the six-month visit to 57% (IQR 52–63%) (
p
< 0.001). As
seen in Table 5, this was accompanied by significant reductions
in LVEDD, LVESD, LA and PASP at the six-month follow up.
Of note, only 17/83 (20%) subjects who had a pre-operative
EF > 55% maintained their EF at two weeks (
p
< 0.001, 95%
CI: 0.02–0.09); at the six-month visit, 50/83 (60%) subjects
achieved their pre-operative EF > 55% (
p
< 0.001, 95% CI:
0.1–0.5).
Discussion
RHD remains the major cause of cardiac morbidity and
mortality in young adults with cardiovascular disease.
12,13
Most
of our subjects (83%) undergoing MVR for severe rheumatic
MR were under the age of 25 years; two-thirds presented with
severe functional disability (NYHA III–IV) and over a third
were in advanced heart failure. Despite this, the overall response
to surgery was good: among the 70% who returned to follow
up at the six-month visit, all but one patient had resolution of
their heart failure, with almost complete resolution of TR. The
finding of persistent TR in the group with pre-operative EF >
60% suggests the presence of underlying organic tricuspid valve
disease in these patients, which was not addressed at surgery.
14
A sobering finding of this study is that 37 (28%) subjects
underwent surgery with an EF < 60% and ESD > 45 mm,
which is well beyond the established guidelines recommended
for MVR.
5
This pattern is a frequent finding in developing
countries where many patients present for the first time with
poor prognostic echocardiographic parameters such as an EF
< 60% or an ESD > 45 mm.
13
Suri
et al.
demonstrated that
the predictors of preserved LV function post-operatively were
pre-operative EF > 65% or LVESD < 36 mm.
15
An EF < 60%
has been shown to be associated with poorer survival rates after
corrective surgery and is likely to indicate contractile dysfunction
in MR patients.
7
Tribouilloy
et al
. showed that LVESD > 40 mm independently
predicted higher mortality rates in patients who were medically
managed, as well as in those who underwent mitral valve surgery.
8
Our paired analysis of 83 patients revealed that although the
EF 40–49%
EF 50–59%
EF > 60%
70
60
50
40
30
20
Pre-op
LA (mm)
2 wks 6 wks
– 3 mo
6 mo
– 2 yrs
0
10
60
50
40
30
20
LVESD (mm)
0
10
Pre-op 2 wks 6 wks
– 3 mo
6 mo
– 2 yrs
60
70
50
40
30
20
LVEDD (mm)
0
10
Pre-op 2 wks 6 wks
– 3 mo
6 mo
– 2 yrs
60
70
50
40
30
20
PASP (mmHG)
0
10
Pre-op 2 wks 6 wks
– 3 mo
6 mo
– 2 yrs
60
70
50
40
30
20
EF (%)
0
10
Pre-op 2 wks 6 wks
– 3 mo
6 mo
– 2 yrs
Fig. 1.
Trend for pre- and postoperative echocardiographic data at follow up. LVESD, LVEDD, LA, EF and PASP are depicted as
per the pre-operative EF groups (40–49%, 50–59%, > 60%) over the follow-up intervals of two weeks, six weeks to three
months and six months to two years. EF improved steadily in all groups after an initial decline in the immediate postoperative
phase. Only three patients with EF 40–49% reached postoperative EF > 50% at six months. Chamber dimensions, LA size
and PASP all decreased after surgery except in the group with EF 40–49%.
Table 5. Paired analysis showing change in
echocardiographic parameters (
n
= 83)
Pre-surgery
6 months
Change
p
-value
EF (%)*
63 (58–70)
57 (52–63)
–5
< 0.001
LVEDD (mm)
60.2 ± 7.9
48.6 ± 8.3
–11.6
< 0.001
LVESD (mm)
39.9 ± 6.6
33.2 ± 8.4
–6.7
< 0.001
LA (mm)
61.9 ± 10.1 43.7 ± 10.1
–18.2
< 0.001
PASP (mmHg)
63.9 ± 23.4 37.4 ± 8.8
–26.5
< 0.001
Except for EF showing median (IQR), all other dimensions reflect mean ± SD.
LA, left atrium; LVEDD, left ventricular end-diastolic dimension; LVESD, left
ventricular end-systolic dimension; PASP, pulmonary artery systolic pressure.