


 57 / 64

CARDIOVASCULAR JOURNAL OF AFRICA • Volume 31, No 5, September/October 2020
AFRICA
277
LV diastolic function with E (0.8 m/s)/A (0.6 m/s) = 1.5, e
′
(6.9
cm/s)/a
′
(6.3 cm/s) = 1.1 and E/e
′
= 11.6.
After discharge, the patient discontinued the prednisolone and
warfarin treatment for personal reasons. Symptoms of high fever
(39°C), chest pain and shortness of breath recurred, associated
with a severe cough and nocturnal dyspnoea at one month
after discharge. At the second admission, the patient’s body
temperature was 38.2°C and blood pressure was 90/60 mmHg.
He appeared acutely ill with a restricted semi-fowler position; a
rash was seen all over his trunk and four limbs (Fig. 6); obvious
jugular vein distension was noted on the bilateral neck regions;
and moist rales were heard at the bases of both lungs. His
heart rate was 110 beats per minute with a regular rhythm. A
holosystolic blowing murmur with 4/6 degree was heard at the
auscultatory mitral area associated with concomitant S
3
gallop.
In addition, a moderate pitting oedema was noted on both legs.
A routine blood test showed a WBC count of 47.75 × 10
9
cells/l, with 67.6% eosinophil and a total blood count of 24.53
× 10
9
cells/l. His international normalised ratio, troponin-I,
D-dimer, and NT-proBNP were 1.85, 3.17 ng/ml, 2 273 ng/ml
and 9 690 pg/ml, respectively. An ECG showed sinus tachycardia,
premature ventricular contractions and ST-segment depression
with inverted T waves on V
1
–V
6
leads (Fig. 1B). Chest CT
showed a bilateral pleural effusion with large flaky high-density
infiltrates throughout the right lung and the inferior left lung
(Fig. 4B).
A TTE recheck showed a significantly thickened LV wall,
accompanied by an enlarged right atrium (48.1 × 55.3 mm) and
left atrium (antero-posterior diameter of 41.3 mm). The mitral,
aortic and tricuspid regurgitation areas were increased to 8.0,
1.9 and 4.8 cm
2
, respectively (Fig. 3B). The pulmonary arterial
pressure was increased to 63.0 mmHg. The LV systolic function
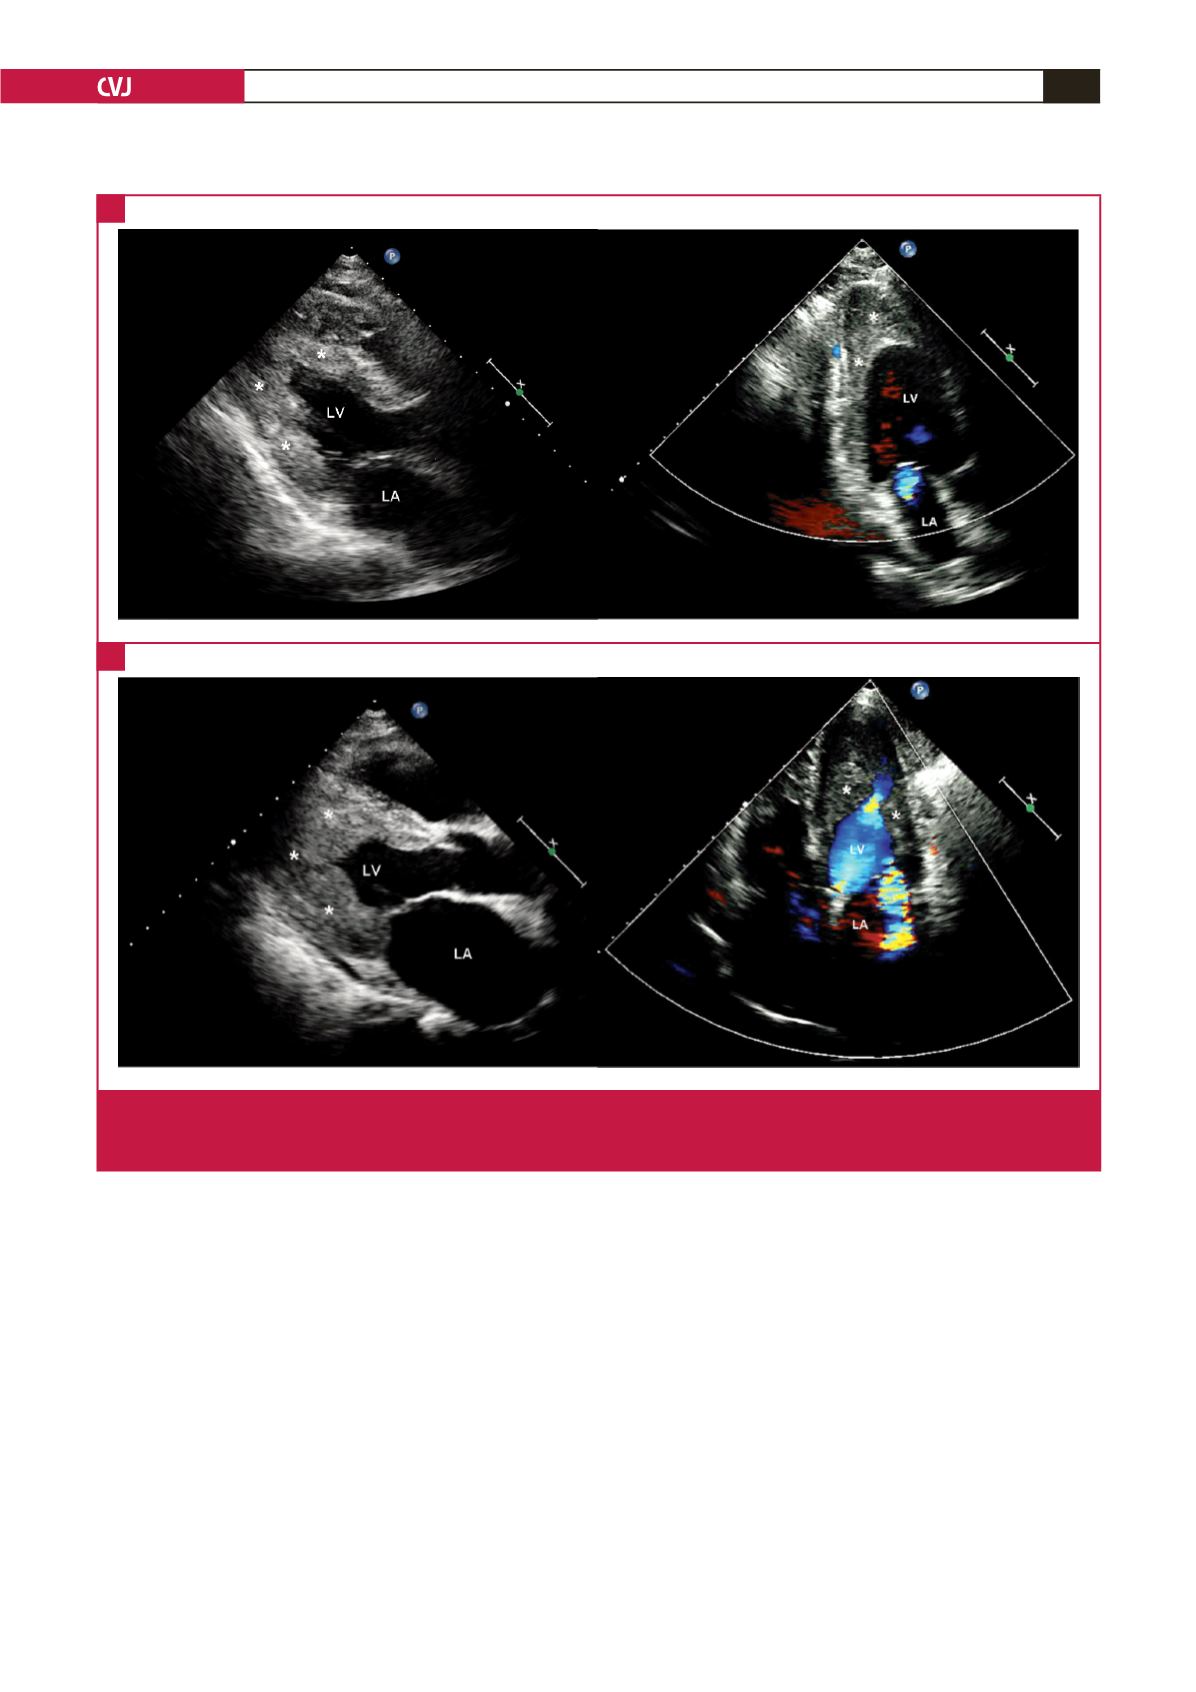
Fig. 3.
Transthoracic echocardiography. A: images on the first admission. B: images on the second admission. On the left are images
in LV long-axis view, and on the right are colour Doppler images showing mitral regurgitation. The white asterisks indicate
the markedly thickened LV wall.
A
B