


 37 / 60

CARDIOVASCULAR JOURNAL OF AFRICA • Volume 32, No 2, March/April 2021
AFRICA
91
measured over the last six weeks of the 16-week diet regime.
Treatment with the GRT extract showed no effect on food
intake. However, control animals treated with the GRT extract
showed a significant increase in water intake when compared
to the untreated control animals. HFD animals treated with the
GRT extract presented with a decrease in leptin levels, and IP fat,
liver and absolute body weight when compared to the untreated
HFD animals. Additionally, treatment with the GRT extract and
captopril in the HFD animals significantly decreased the mean
systolic, diastolic and arterial blood pressure compared to the
untreated HFD group. Lastly, GRT treatment did not affect the
blood pressure, leptin levels, and IP fat, liver and absolute body
weight of the control animals.
In week 15, the blood glucose levels (Fig. 2A) of the HFD and
control (GRT treated and untreated) animals were determined
after an overnight fast. According to the AUC analysis (Fig.
2B), the HFD rats showed a significant increase in blood glucose
levels when compared to the control animals (741.1 ± 16.20
vs 671.5 ± 23.93 arbitrary units;
p
< 0.05,
n
= 6–8 per group).
Treatment with the GRT extract significantly decreased blood
glucose levels in the treated HFD animals when compared to the
untreated HFD animals (657.2 ± 32.02 vs 741.1 ± 16.20 arbitrary
units;
p
< 0.05,
n
= 6–8 per group). Furthermore, treatment with
GRT extract also significantly decreased the blood glucose levels
in the treated control animals, relative to the untreated controls
(555.9 ± 56.45 vs 688.9 ± 19.02 arbitrary units,
n
= 6–8 per
group). Interestingly, 100% of the untreated control and HFD
animals presented with normal glucose excretion in their urine,
whereas 50% of the GRT extract-treated control and HFD
animals presented with increased glucose excretion in their urine
(
n
= 6–8 per group, Table 3).
As shown in Fig. 3A, the HFD animals presented with a
decrease in vascular contractility compared to the control group
(
p
= 0.0011), and the HFD animals treated with GRT extract
showed a significant reduction in vascular contractility compared
to the untreated HFD animals (
p
= 0.0107). Additionally,
supplementation with the GRT extract significantly increased
vascular relaxation in the HFD group compared to the untreated
HFD group (Fig. 3B,
p
= 0.0001). The same effect was observed
in the HFD captopril-treated group compared to the untreated
HFD group (
p
= 0.0123) (Fig. 3B).
To elucidate the possible mechanisms behind the vascular
effects observed in the GRT extract-treated groups, the signalling
proteins involved in endothelial function were analysed
with Western blot analysis. The data in Fig. 4 reflect the
total (T) expression, phosphorylated (P) protein levels and
phosphorylated:total (P:T) ratio of each protein. The HFD
animals presented with a significantly lower T-AMPK expression
and P-AMPK level, respectively, when compared to the control
animals (Fig 4A, B). Treatment of the HFD rats with the GRT
extract upregulated the P:T AMPK ratio (Fig. 4C) but had no
significant effect on T-AMPK and P-AMPK levels. Additionally,
captopril upregulated P-AMPK levels and the P:T AMPK ratio.
Table 3. Summary of the biometric and blood pressure measurements during and after the 16-week treatment period
Parameters
Control
HFD
Control + GRT extract HFD + GRT extract
HFD + captopril
Food intake (g)
17.11 ± 0.529
20.64 ± 0.631***
17.45 ± 0.468
21.11 ± 0.622
nd
Water intake (ml)
23.38 ± 0.442
17.01 ± 0.647****
26.66 ± 0.859
###
14.76 ± 1.324
nd
Body weight (g)
339.50 ± 6.870
396.20 ± 13.660**
324.30 ± 7.460
344.50 ± 11.740
@
nd
IP fat weight (g)
7.32 ± 0.995
23.79 ± 3.481***
8.27 ± 0.596
13.90 ± 1.315
@
nd
Liver weight (g)
10.30 ± 0.392
15.23 ± 0.803****
10.20 ± 0.411
11.70 ± 0.541
nd
Leptin assay (pg/ml)
2858 ± 210.80
5477 ± 791.50*
2948 ± 185.70
2431 ± 608.70
nd
Mean systolic blood pressure (mmHg)
122.30 ± 1.317
134.00 ± 1.770***
119.90 ± 1.252
120.60 ± 1.531
@@@@
115.40 ± 1.381
$$$$
Mean diastolic blood pressure (mmHg)
81.270 ± 1.645
91.64 ± 1.477****
79.22 ± 1.428
81.02 ± 1.482
####
78.96 ± 0.739
@@@@
Mean arterial pressure (mmHg)
94.94 ± 1.417
105.80 ± 1.415****
92.80 ± 1.283
94.22 ± 1.431
####
91.09 ± 0.8434
@@@@
Urinary glucose (mmol/l)
Normal in 100% of
animals
Normal in 100% of
animals
Glucose present in
50% of animals
Glucose present in
50% of animals
nd
All data are expressed as mean ± SEM, two-way ANOVA was used for result analysis. nd, not determined.
*
p
< 0.05, **
p
< 0.01, ***
p
< 0.001, ****
p
< 0.0001 HFD versus control;
###
p
< 0.001 control + GRT versus control;
@
p
< 0.05,
@@@@
p
< 0.0001 HFD + GRT versus
HFD,
$$$$
p
< 0.0001 HFD + captopril versus HFD,
n
= 10 per group.
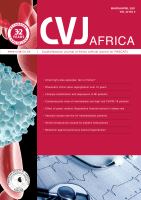
Time (minutes)
Glucose level (mmo/l)
OSTT
8
9
7
6
5
4
0 3 5 10 15 20 25 30 45 60 90 120
Control
HFD
**
****
* ** * *
*
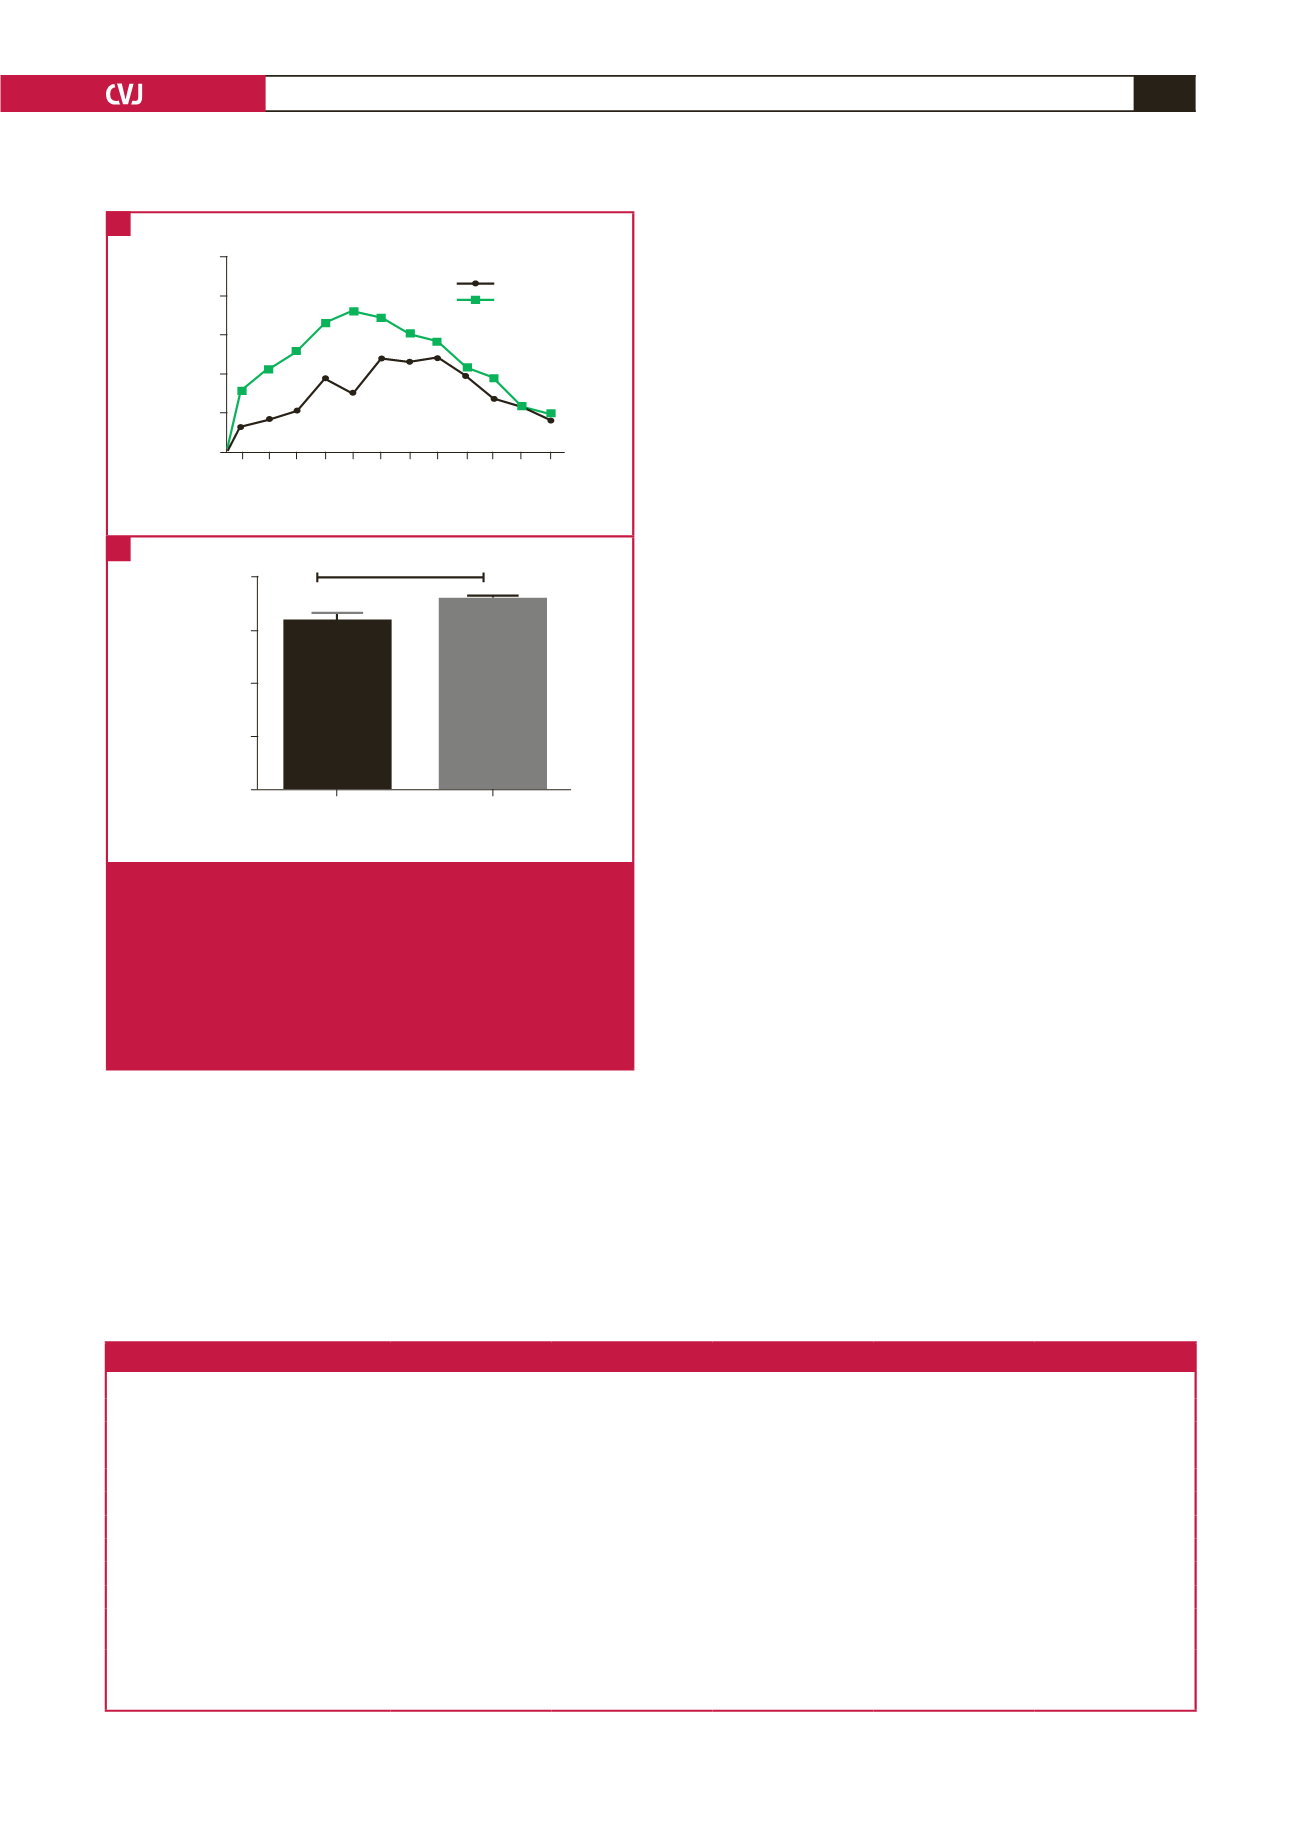
800
600
400
200
Control
AUC
(arbitrary units)
HFD
Groups
0
Fig. 1.
OSTT results and AUC representation of the HFD and
control animals measured in week 10,
n
= 7–8 per
group. (A) Plasma blood glucose levels (mmol/l) of the
HFD versus control animals; *
p
< 0.05; **
p
< 0.01 and
****
p
< 0.0001, HFD versus control. (B) AUC represen-
tation of the effect of the diet on glucose tolerance of
the HFD versus control groups; *
p
< 0.05, HFD versus
control group.
A
B