


 40 / 60

CARDIOVASCULAR JOURNAL OF AFRICA • Volume 32, No 2, March/April 2021
94
AFRICA
Control
T-PKB
Minus GRT
Plus GRT
HFD + captopril
Groups
Effect of diet:
p
< 0.05
Ratio
CON 1-5
C+GRT 1-5
HFD 1-5
HFD+GRT1-5
Captoril 1-5
HFD
56 kDa
***
0.0
0.5
1.5
1.0
Minus GRT
Plus GRT
HFD + captopril
Groups
Control
HFD
Effect of diet:
p
< 0.05
Ratio
CON 1-5
C+GRT 1-5
HFD 1-5
HFD+GRT1-5
Captoril 1-5
56 kDa
*
*
*
**
0.0
0.5
1.5
1.0
P-PKB
Control
P:T PKB ratio
Minus GRT
Plus GRT
HFD + captopril
HFD
1.5
0.5
1.0
0.0
Groups
Ratio
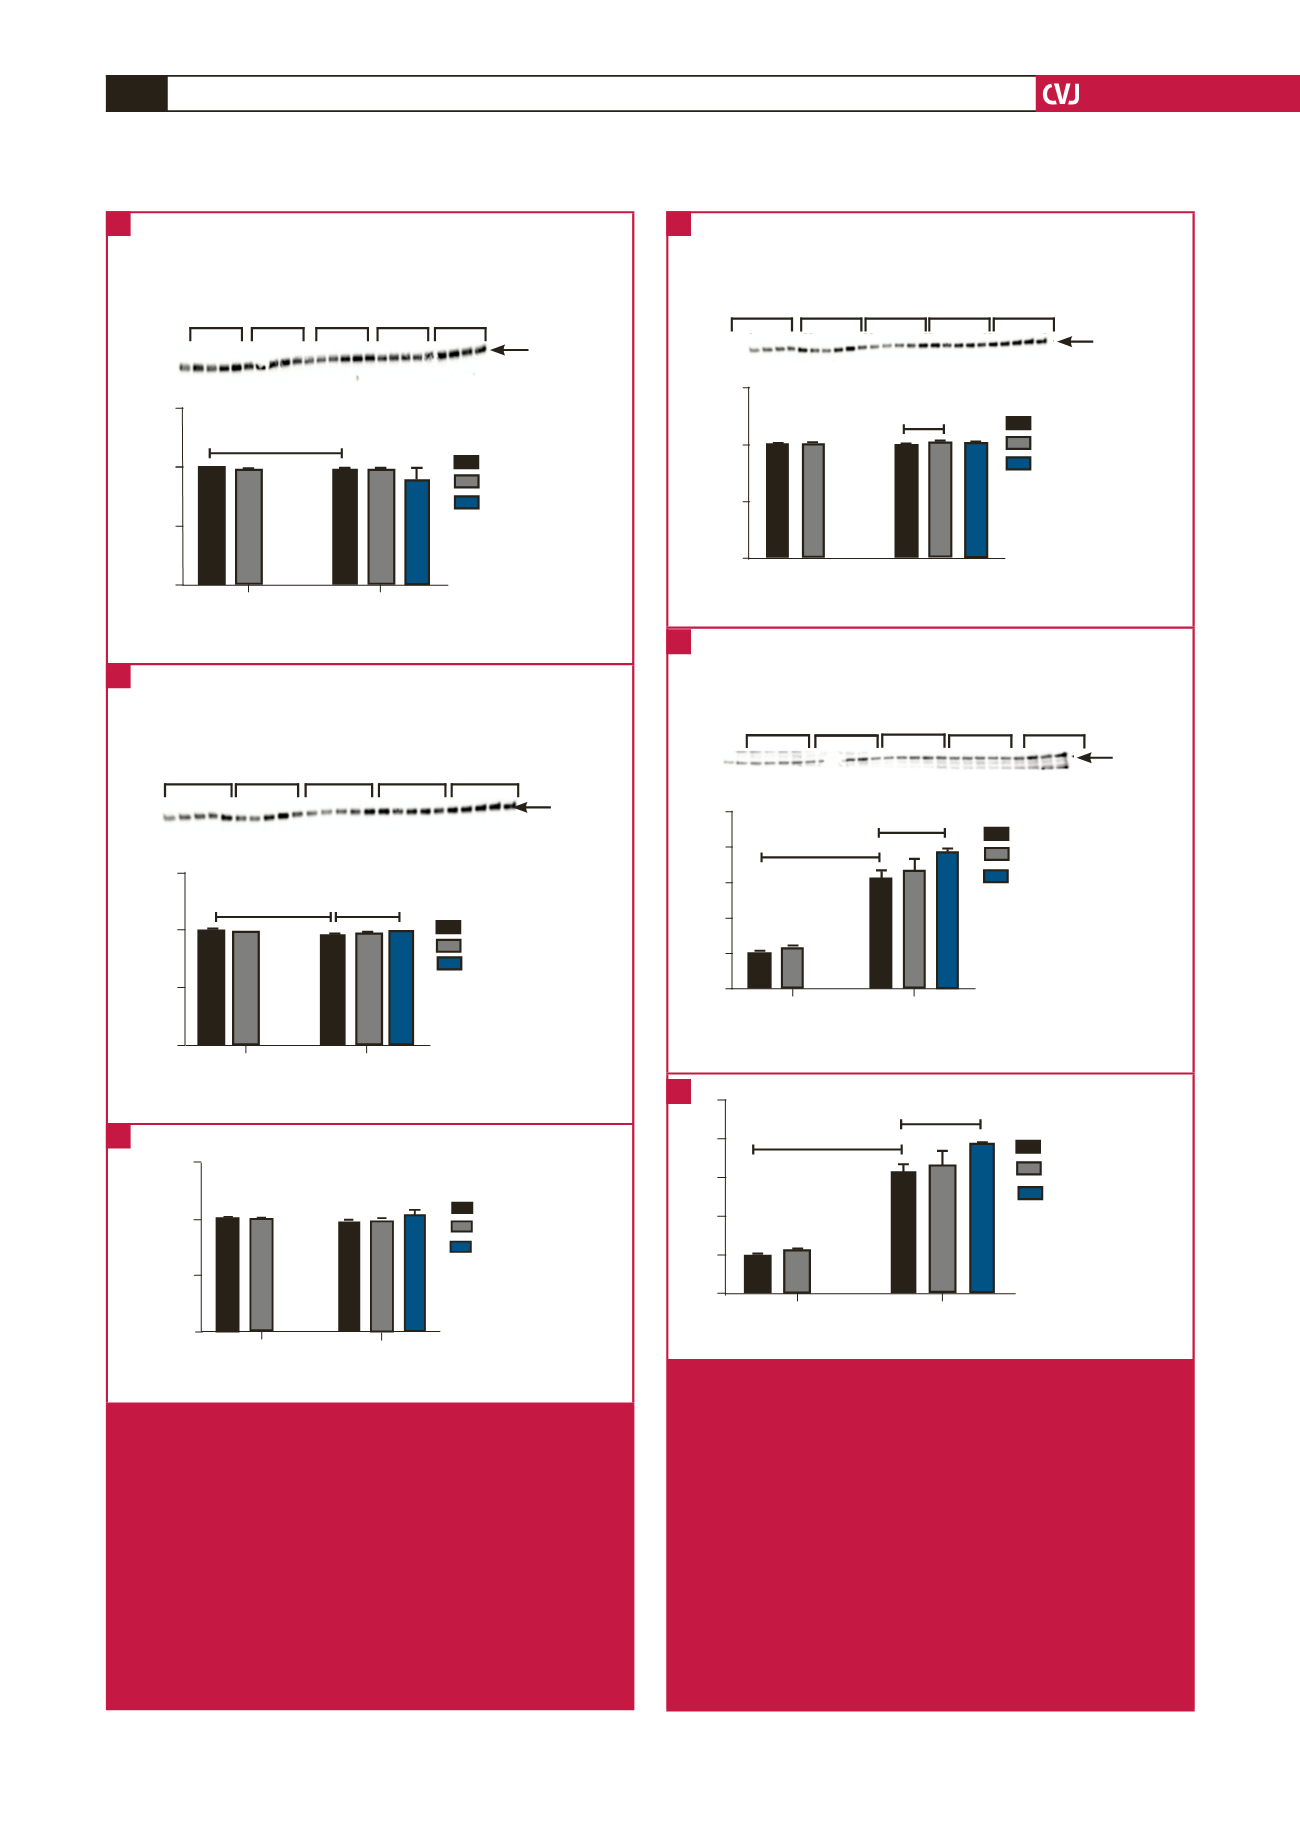
Fig. 5.
PKB expression in the aortic rings of the HFD versus
control groups (GRT treated and untreated), including
the HFD animals treated with captopril. (A) T-PKB;
***
p
< 0.001, HFD versus control groups (
n
= 5 per
group). According to two-way ANOVA, the HFD had a
significant effect (
p
< 0.05) on T-PKB expression (
n
= 5
per group). (B) P-PKB; **
p
< 0.01, HFD versus control
groups; ***
p
< 0.001, HFD + captopril versus HFD
groups. According to two-way ANOVA, the HFD had a
significant effect (
p
< 0.01) on P-PKB levels (
n
= 5 per
group). (C) P:T PKB ratio; no significant differences
between the groups
A
B
Control
0.5
1.0
1.5
0.0
T-eNOS
CON 1-5
C+GRT 1-5
HFD 1-5
HFD+GRT1-5
Captoril 1-5
140 kDa
Minus GRT
Plus GRT
HFD + captopril
HFD
Groups
Effect of GRT:
p
< 0.001
Ratio
**
***
*
Control
P-eNOS
CON 1-5
C+GRT 1-5
HFD 1-5
HFD+GRT1-5
Captoril 1-5
140 kDa
Minus GRT extract
Plus GRT extract
HFD + captopril
HFD
0
1
2
3
4
5
Groups
Effect of diet:
p
< 0.001
Ratio
Control
P:T eNOS ratio
Minus GRT
Plus GRT
HFD + captopril
HFD
5
4
3
2
1
0
Groups
Effect of diet:
p
< 0.001
Ratio
***
*
Fig. 6.
eNOS expression in the aortic rings of the HFD versus
control groups (GRT treated and untreated), including
the HFD animals treated with captopril. (A) T-eNOS;
**
p
< 0.01, HFD + GRT versus HFD groups. According
to two-way ANOVA, the GRT had a significant effect (
p
< 0.01) on T-eNOS expression (
n
= 5 per group). (B)
P-eNOS; ***
p
< 0.001, HFD versus control groups; *
p
< 0.05, HFD + captopril versus HFD groups. According
to two-way ANOVA, the HFD had a significant effect (
p
< 0.001) on the P-eNOS levels (
n
= 5 per group). (C)
P:T eNOS; ***
p
< 0.001 HFD versus control groups;
HFD + captopril versus HFD groups. According to
two-way ANOVA, the HFD had a significant effect (
p
<
0.001) on P:T eNOS levels (
n
= 5 per group).
A
B
C
C