


 38 / 60

CARDIOVASCULAR JOURNAL OF AFRICA • Volume 32, No 2, March/April 2021
92
AFRICA
The HFD animals showed a significant decrease in the T-PKB
expression and P-PKB levels when compared to the control
group (Fig. 5A, B). Treatment with captopril significantly
increased P-PKB levels and treatment with GRT extract showed
no significant effect. Furthermore, no significant differences
were observed in the PKB P:T ratio in all the groups assessed
(Fig. 5C). HFD animals presented with an increase in P-eNOS
(Fig. 6B) and P:T eNOS (Fig. 6C) ratio when compared to
the control animals. The GRT extract significantly increased
T-eNOS expression (Fig. 6A) with no significant effect on
P-eNOS and P:T eNOS levels.
Activities of the primary antioxidant enzymes were determined
in the liver (Table 4). The HFD animals had significantly lower
SOD, CAT and GPx activity and increased MDA levels when
compared to the control animals. Supplementation with GRT
extract in the HFD animals significantly increased SOD and CAT
activity and decreased MDA levels when compared to the untreated
HFD animals. Additionally, the GRT extract in the treated control
animals significantly increased GPx activity and decreased MDA
levels when compared to the untreated control animals.
Discussion
Obesity, especially visceral obesity, results in enlargement of the
adipose tissue, a major storage site for excess energy, which is
also considered a secretion site for pro- and anti-inflammatory
cytokines.
5
Therefore in an obese state, there is upregulation
in the release of pro-inflammatory cytokines, downregulation
of anti-inflammatory cytokines and increased free fatty
acid (FFA) release into the circulation.
5
The released FFA
and pro-inflammatory cytokines enter the liver and skeletal
muscle cells and induce modifications in lipid and glucose
homeostasis in these metabolic tissues, including modification
in the inflammatory responses. As a result, this imbalance
greatly contributes to the development of insulin resistance,
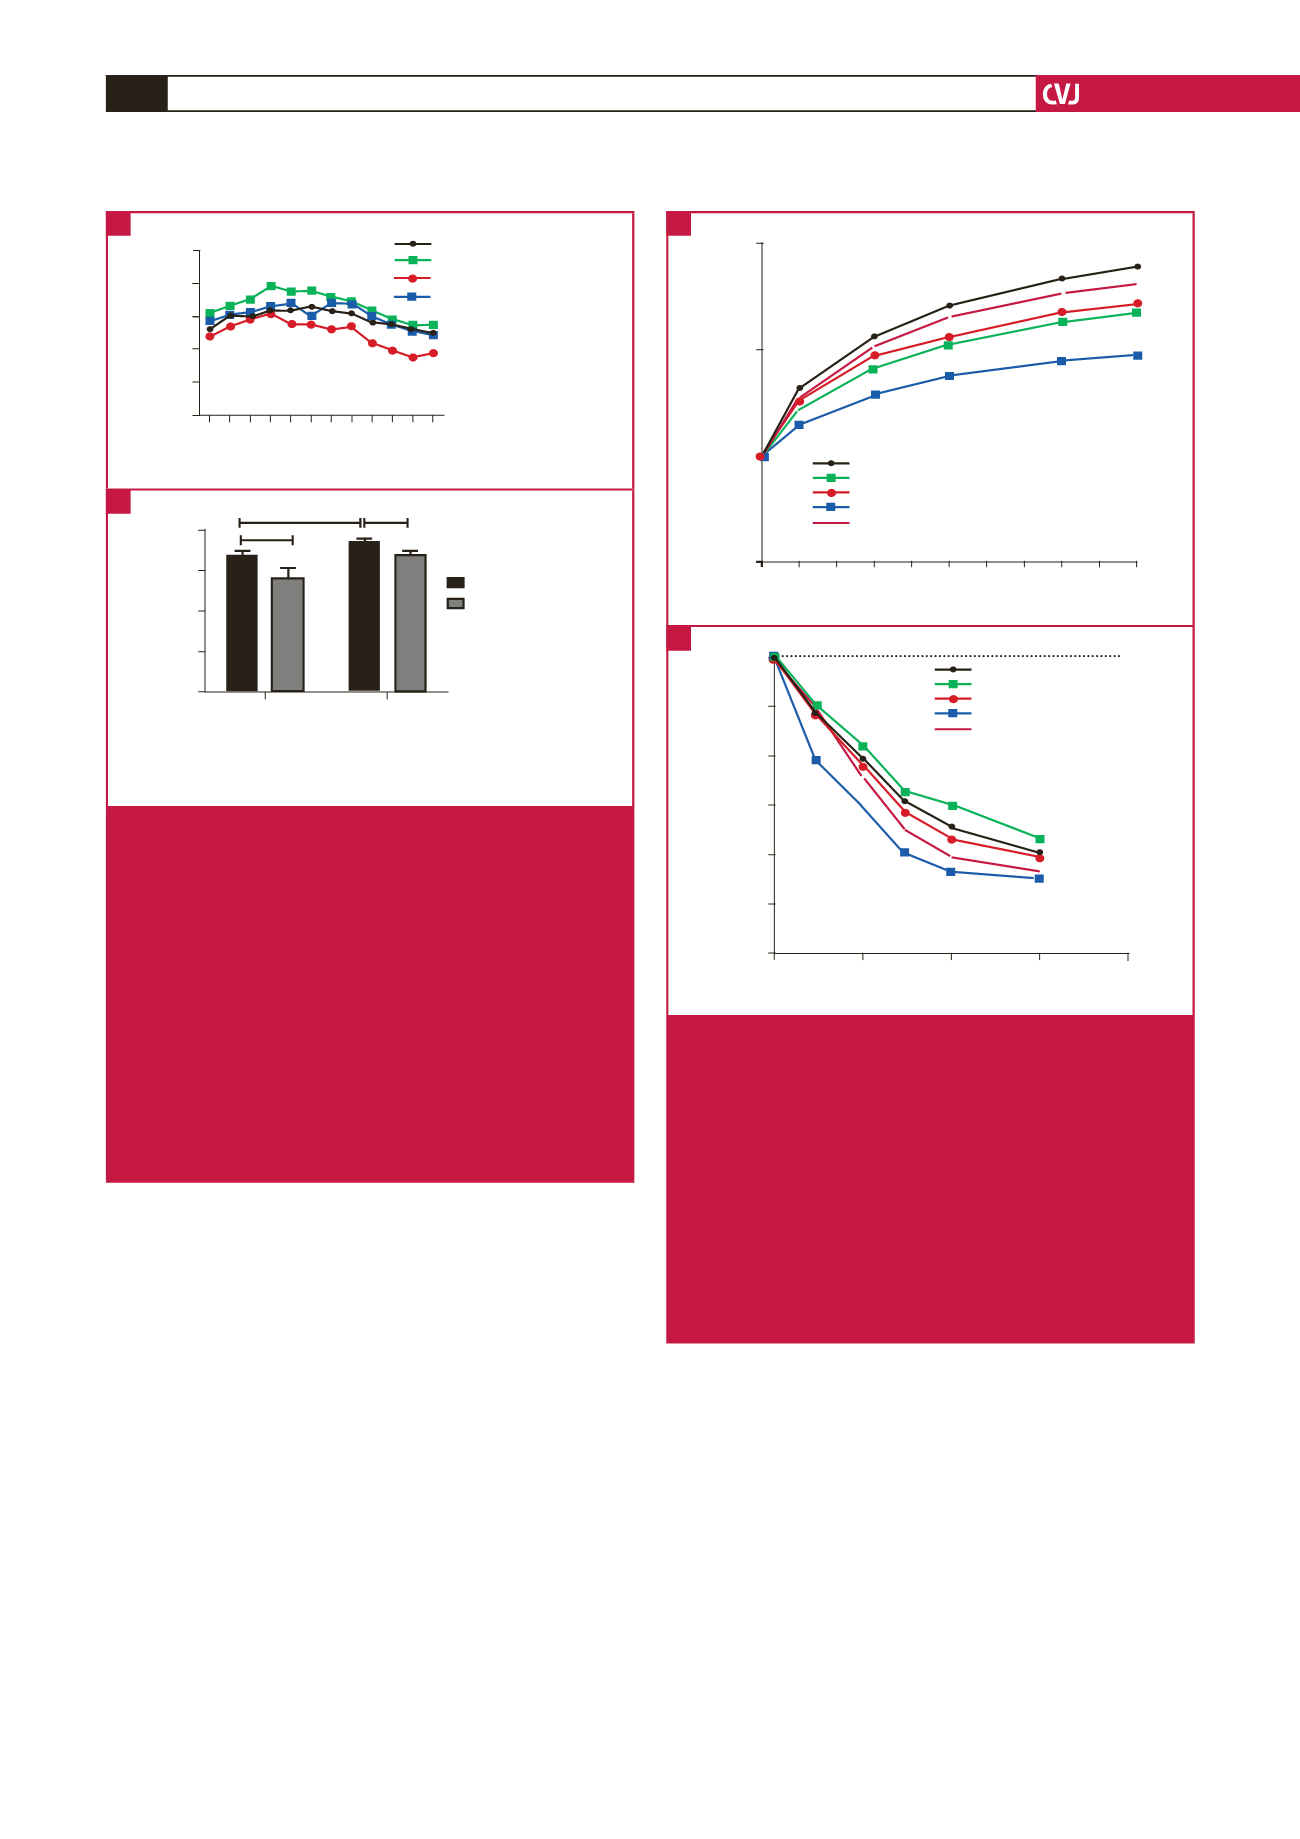
Tension (g)
2.5
2.0
1.5
1.0
0.0 0.0 0.2 0.3 0.4 0.5 0.6 0.7 0.8 0.9 1.0
Phenylephrine (
μ
M)
Control
HFD
Control + GRT
HFD + GRT
HFD + captopril
*
*
*
*
*
*
*
0
20
40
60
80
100
120
-8
-7
-6
log [Ach] (M)
% Relaxation
-5
-4
Control
HFD
Control + GRT
HFD + GRT
HFD + captopril
*
*#
*
*
*
*
*
Fig. 3.
Vascular contraction and relaxation measured in the
aortic tissue of the HFD versus control groups (treated
and untreated), including the HFD + captopril groups,
n
= 8–10 per group. (A) Cumulative phenylephrine-
induced vascular contraction in the HFD versus
control groups (GRT treated and untreated), including
the HFD + captopril groups; *
p
< 0.001, HFD versus
control and
#
p
< 0.05, HFD + GRT versus HFD. (B)
Cumulative acetylcholine-induced vascular relaxation
in the HFD versus control groups (GRT treated and
untreated), including the HFD + captopril groups; *
p
<
0.0001, HFD versus HFD + GRT and
#
p
< 0.05, HFD
versus captopril groups.
A
B
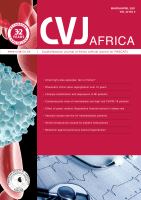
Time (minutes)
Glucose level (mmo/l)
OSTT
10
8
6
4
2
0
0 3 5 10 15 20 25 30 45 60 90120
Control
HFD
Control + GRT
HFD + GRT
Minus GRT
Plus GRT
HFD
800
600
400
200
0
Groups
Effect of diet:
p
< 0.05
Effect of GRT extract:
p
< 0.05
Control
(arbitrary units)
AUC
*
*
*
Fig. 2.
OSTT results and AUC representation of the HFD
and control animals (GRT treated and untreated)
measured in week 15,
n
= 6–8 per group. All data are
expressed as SEM. (A) Plasma blood glucose levels
(mmol/l) of the HFD versus control groups (GRT
treated and untreated). (B) AUC representation of the
effect of diet and GRT extract on glucose tolerance
of the HFD versus control groups (GRT treated and
untreated); *
p
< 0.05, HFD versus control group and
*
p
< 0.05, HFD + GRT versus HFD group. According
to a two-way ANOVA, the HFD resulted in a significant
(
p
< 0.05) increase in blood glucose levels in the HFD
animals relative to the control animals. Additionally,
the GRT extract significantly (
p
< 0.05) attenuated the
increase in glucose levels in the HFD group.
A
B