


 39 / 60

CARDIOVASCULAR JOURNAL OF AFRICA • Volume 32, No 2, March/April 2021
AFRICA
93
hyperglycaemia, dyslipidaemia, hypertension, endothelial
dysfunction (ED) and oxidative stress.
5
Leptin and angiotensinogen serve as examples of
pro-inflammatory adipokines, which contribute to the
dysregulation in adipocyte metabolism. A number of studies
have shown the ameliorative effects of unfermented rooibos
against the above obesity-induced CVD risk factors,
8,9,11-13,16-18
resulting from adipocyte hypertrophy. Fermented rooibos has
been shown to inhibit adipogenesis and intracellular lipid
accumulation, and it attenuates leptin secretion.
25
This was
mainly attributed to its polyphenolic content, with aspalathin
and nothofagin as active and the most abundant compounds.
The HFD used in this study successfully induced obesity in
the Wistar rats,
19,26
and excess consumption of a high-fat, high-
sugar diet has been previously shown as a contributing factor
to obesity.
27,28
The increase in food intake by the HFD animals
contributed to their higher body weight, leptin levels, and IP fat
and liver mass (Tables 2, 3), which has been previously shown in
obese rats fed aHFD.
28-32
Increased liver weight may be attributed
to the increase in FFA release from the enlarged adipose tissue
and increased lipid synthesis in the liver.
5
Additionally, the
HFD animals had impaired glucose homeostasis (Figs 1, 2),
as was previously documented by studies that used a similar
diet.
19,26
Increased leptin levels and excessive accumulation
of triglycerides in the liver have also been associated with
dysregulation in glucose homeostasis.
30
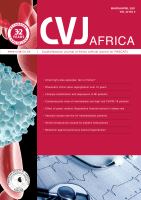
The impairment in
glucose homeostasis observed in the HFD animals was also
supported by downregulation in the expression of AMPK in
the vascular system (Fig. 4), an insulin-independent signalling
protein. This protein is responsible for glucose uptake and NO
production via the phosphorylation of eNOS.
33,34
Furthermore, the HFD animals had increased blood
pressure (Tables 2, 3), and decreased vasocontraction (Fig.
3A) and vasorelaxation (Fig. 3B). Increased blood pressure is
as a result of an impairment in vasodilation, due to reduction
in NO availability or production in the endothelial cells, a
condition defined as ED.
35,36
Interestingly, the HFD animals
presented with an upregulation in eNOS phosphorylation
(Fig. 6B) despite the increased blood pressure and decrease in
vasodilation. We speculate that this could be as a result of the
decrease in SOD enzyme activity (Table 4), which contributes
to a reduction in NO bioavailability via the eNOS uncoupling
process. This process occurs when NO binds with superoxide
radical-producing peroxynitrite, a highly reactive free radical,
in the absence of the SOD enzyme.
36
A
B
C
Control
T-AMPK
Minus GRT
Plus GRT
HFD + captopril
Groups
Effect of diet:
p
< 0.0001
Ratio
HFD
63 kDa
0.0
0.5
1.5
1.0
CON 1-5
C+GRT 1-5
HFD 1-5
HFD+GRT1-5
Captoril 1-5
****
Control
P-AMPK
Minus GRT
Plus GRT
HFD + captopril
Groups
Effect of diet:
p
< 0.001
Ratio
CON 1-5
C+GRT 1-5
HFD 1-5
HFD+GRT1-5
Captoril 1-5
HFD
63 kDa
0.0
0.5
1.5
1.0
****
*
P:T AMPK Ratio
Minus GRT
Plus GRT
HFD + captopril
Effect of diet:
p
< 0.05
Ratio
0.0
Control
HFD
0.5
1.5
1.0
****
*
Groups
Fig. 4.
AMPK expression in the aortic rings of the HFD versus
control groups (GRT treated and untreated), including
the HFD animals treated with captopril. (A) T-AMPK
expression; ****
p
< 0.0001, HFD versus control groups.
According to two-way ANOVA, the HFD had a signifi-
cant effect (
p
< 0.0001) on the T-AMPK expression (
n
=
5 per group). (B) P-AMPK expression; ****
p
< 0.0001,
HFD versus control groups; *
p
< 0.05, HFD + captopril
versus HFD + GRT groups. According to two-way
ANOVA, the HFD had a significant effect (
p
< 0.001)
on the P-AMPK levels (
n
= 5 per group). (C) P:T AMPK
ratio; *
p
< 0.05, HFD + GRT versus HFD groups; ****
p
< HFD + captopril versus HFD group. According to two-
way ANOVA, the GRT extract had a significant effect (
p
< 0.05) on the P:T AMPK ratio (
n
= 5 per group).
Table 4. Summary of primary antioxidant enzyme activity
in the liver of the HFD versus control groups
(GRT treated and untreated),
n
= 9–10 per group
Parameters
Control
Control +
GRT extract
HFD
HFD + GRT
extract
SOD (units/mg)
281.90 ±
10.640
320.60
± 19.260
227.60 ±
5.631***
335.60 ±
37.310
@@
CAT (µmole/min/
µg)
91.88 ± 6.507 101.3 ± 5.252 63.59 ±
2.801***
76.88 ±
3.900
@
GPx (µmole/min/
mg protein)
0.01848 ±
0.00164
0.03535 ±
0.00612
#
0.003563 ±
0.000889****
0.007414 ±
0.0007801
@@
Malondialdehyde
(µmol/mg) protein)
3.60 ± 0.276 2.51 ± 0.226
##
5.12 ±
0.347**
3.10 ±
0.284
@@
All data are expressed as mean ± SEM, **
p
< 0.01, ***
p
< 0.001, ****
p
<
0.0001 HFD versus control;
#
p
< 0.05,
##
p
< 0.001 control + GRT versus
control;
@
p
< 0.05,
@@
p
< 0.01 HFD + GRT versus HFD.