CARDIOVASCULAR JOURNAL OF AFRICA • Vol 23, No 4, May 2012
AFRICA
203
In a study similar to ours, Pillai
et al.
10
assessed pre-operative
NT-proBNP levels in a group of 20 patients with rheumatic
heart disease. They showed that elevated pre-operative
NT-proBNP levels were an indicator of underlying myocardial
dysfunction, which was not evident by routine two-dimensional
echocardiography, and advocated pre-operative assessment of
NT-proBNP levels to detect underlying myocardial dysfunction.
Two other studies have examined patients with varying
degrees of MR, and showed that changes in ventricular function
occur early in the disease process, even before they could be
detected echocardiographically.
11,12
The diastolic filling ratios
were higher in the study group, indicating LV decompensation
and a rise in the filling pressures. However, the diastolic ratios
were also elevated in the control group, suggesting that LV
decompensation with elevated LV filling pressure was already
present in patients deemed by the clinician to be stable enough
to be followed up at the clinic.
The six-week correlation between NT-proBNP levels and
chamber dimensions suggests that in MR, changes in volume
load may be paralleled by changes in the NT-proBNP level and
that the fall in NT-proBNP was related to corrections in volume
and removal of the diastolic run-off into the left atrium. These
results are also in keeping with those found by the Mayo Clinic,
13
which showed that the severity of mitral regurgitation, although
univariately associated with NT-proBNP concentrations, was
not an independent predictor of high NT-proBNP levels. They
examined a group of 124 patients with varying degrees of
organic mitral regurgitation and showed that NT-proBNP level
was independently predictive of mortality/heart failure over a
4.4-year follow-up period.
Increased Em/Ea (
>
12) ratios and elevated NT-proBNP
(
>
170 pg/ml) have been shown to be useful parameters to
identify patients at increased risk of developing paroxysmal
atrial fibrillation (AF) as well as to reflect early left ventricular
Fig. 3. Receiver operating characteristics curve: NYHA all classes.
1.0
0.8
0.6
0.4
0.2
0.0
Sensitivity
0.0
0.2
0.4
0.6
0.8
1.0
1 – Specificity
Digital segments are produced by tiers.
ROC curve
LV Esd
0.769
EF (%)
0.556
BNP pmol/l
0.797
s(l)
0.373
E/Ea(l)
0.623
EOA
0.602
dP/dT
0.326
Regurg. fraction 0.577
Area under the curve
Source of the Curve
LV Esd
EF (%)
BNP pmol/l
s (l)
E/Ea (l)
EOA
dP/dT
Regurg. Fraction
Reference Line
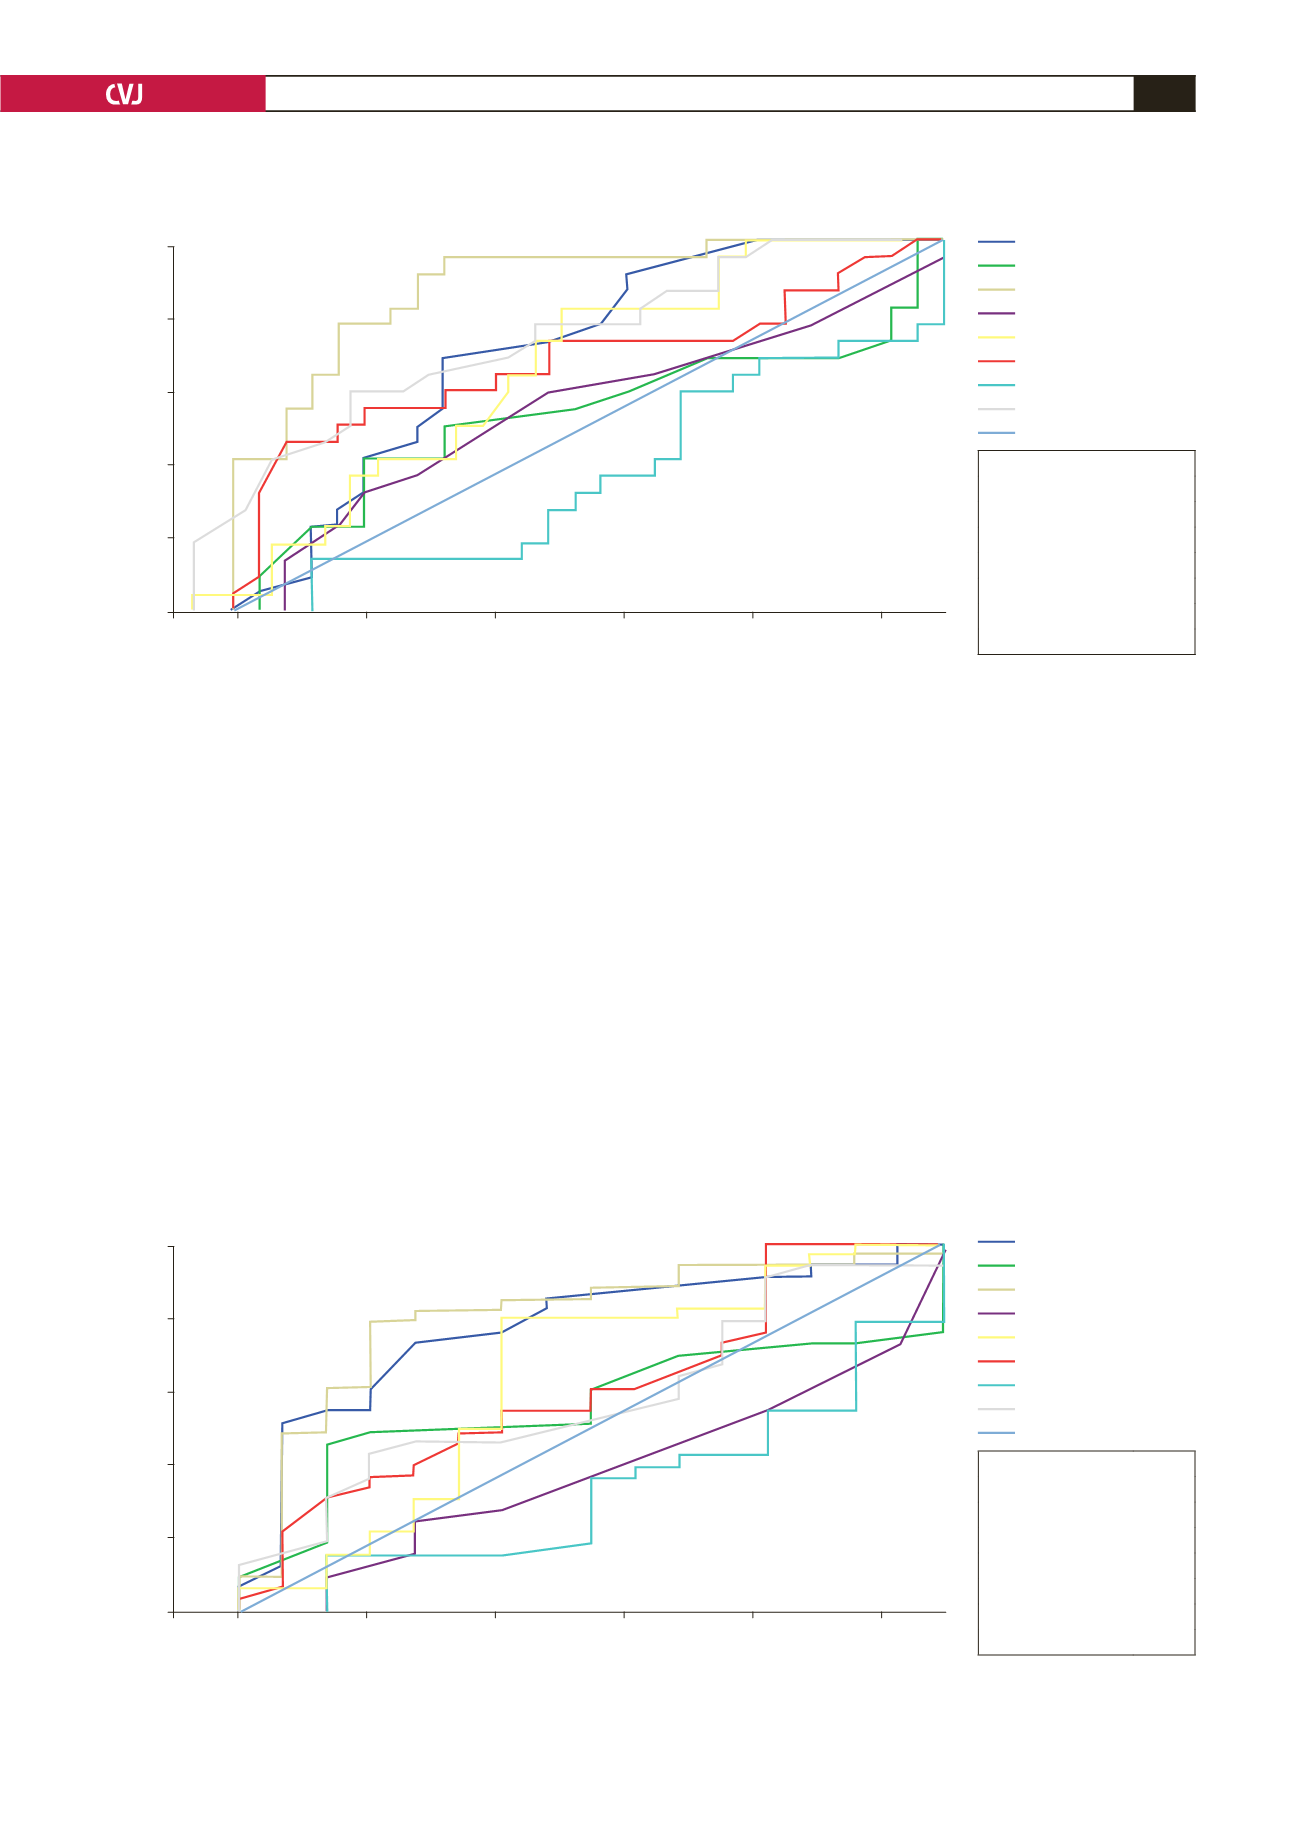
Fig. 2. Receiver operating characteristics curve: surgical cases and controls.
1.0
0.8
0.6
0.4
0.2
0.0
Sensitivity
0.0
0.2
0.4
0.6
0.8
1.0
1 – Specificity
Digital segments are produced by tiers.
ROC curve
LV Esd
0.704
EF (%)
0.529
BNP pmol/l
0.882
s(l)
0.545
E/Ea(l)
0.614
EOA
0.673
dP/dT
0.364
Regurg. fraction 0.711
Area under the curve
dP/dT
Source of the Curve
LV Esd
EF (%)
BNP pmol/l
s (l)
E/Ea (l)
EOA
dP/dT
Regurg. Fraction
Reference Line


