


 15 / 102

CARDIOVASCULAR JOURNAL OF AFRICA • Volume 27, No 3, May/June 2016
AFRICA
137
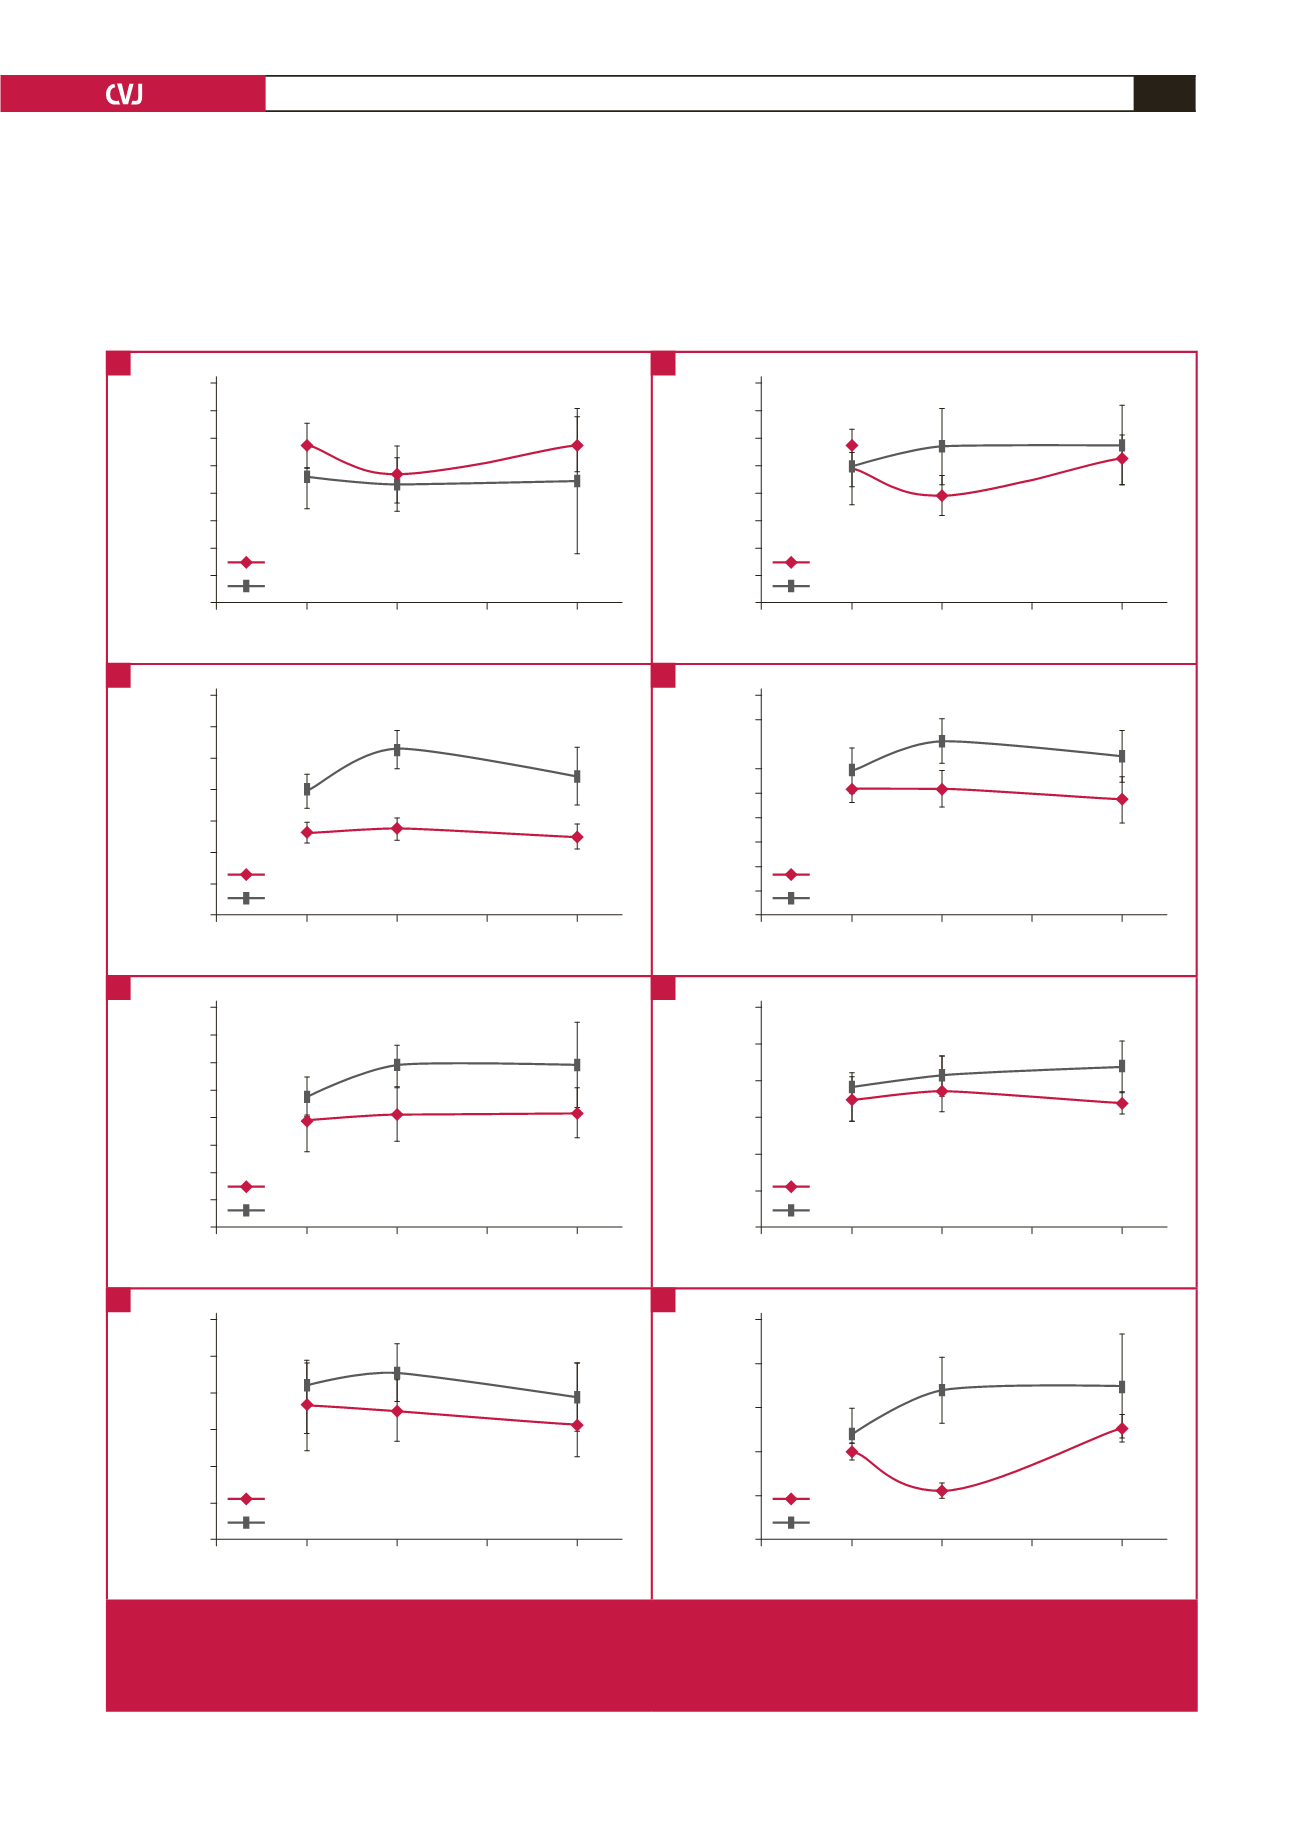
in AAC rats as early as three weeks post surgery, compared to
the controls. This trend continued to four weeks, when the AAC
rats exhibited wall thickening of 193% at diastole (137% at
systole) compared to the sham values. In addition, the AAC rats
exhibited significant thickening of LVPWd at three weeks, which
progressed to 143% of the control values at four weeks.
In the AAC rats, IVS and LVPWd were significantly increased
at all time points, reaching a maximum at four weeks. At six
2
3
4
5
6
Weeks
LVIDd (cm)
0.60
0.55
0.50
0.45
0.40
0.35
0.30
0.25
0.20
Sham
AAC
**
2
3
4
5
6
Weeks
LVIDs (cm)
0.40
0.35
0.30
0.25
0.20
0.15
0.10
0.05
0.00
Sham
AAC
**
2
3
4
5
6
Weeks
IVSd (cm)
0.35
0.30
0.25
0.20
0.15
0.10
0.05
0.00
Sham
AAC
**
**
**
2
3
4
5
6
Weeks
IVSs (cm)
0.45
0.40
0.35
0.30
0.25
0.20
0.15
0.10
0.05
0.00
Sham
AAC
**
*
**
2
3
4
5
6
Weeks
LVPWd (cm)
0.40
0.35
0.30
0.25
0.20
0.15
0.10
0.05
0.00
Sham
AAC
**
**
*
2
3
4
5
6
Weeks
LVPWs (cm)
0.60
0.50
0.40
0.30
0.20
0.10
0.00
Sham
AAC
**
*
2
3
4
5
6
Weeks
IVS/LVPW
1.20
1.00
0.80
0.60
0.40
0.20
0.00
Sham
AAC
**
*
2
3
4
5
6
Weeks
ESV (ml)
0.10
0.08
0.06
0.04
0.02
0.00
Sham
AAC
**
Fig. 3.
M-mode echocardiographic examination of diastolic dimensions (A, C, E, G) and systolic dimensions (B, D, F, H) in sham
and AAC rats; *
p
<
0.05 vs sham control, **
p
<
0.01 vs sham control. The
n
values are given for each group at three, four
and six weeks in sequential order. ANOVA was used to compare the AAC and sham groups, when the probability value was
statistically significant. An LSD
t
-test was applied for multiple comparisons.
A
C
E
G
B
D
F
H