


 14 / 102

CARDIOVASCULAR JOURNAL OF AFRICA • Volume 27, No 3, May/June 2016
136
AFRICA
valve. The Doppler beam was set within 30° of the incident
angle, to the aortic direction. Values for statistical analyses were
averaged data collected from three to five cardiac cycles.
Colour-flow Doppler images were obtained by centering the
sampling area in the region of interest, thus making it possible
to evaluate valvular dysfunction. The same method was used to
measure diameters of the abdominal aorta via the aortic long-
axis view.
All measurements were performed in accordance
with the leading-edge method of the American Society of
Echocardiography.
11
Images were stored digitally on magneto-
optical discs (DICOM).
Morphological analyses
Rat hearts were harvested by cardiectomy and perfused in 30 ml
of ice-cold phosphate-buffered saline to wash out any remaining
blood. The total mass of the hearts and mass of the right and
left ventricles were obtained. Heart mass index (HMI) and LV
mass index (LVMI) were determined as the ratio of LVm (in mg)
to body weight (in g).
The left ventricle was then cut into four pieces along the
longitudinal axis. Three sections were immediately frozen
in liquid nitrogen and one was fixed in 10% formalin for
histological analysis. Tissues were dehydrated through serial
alcohol immersions, cleared in xylene and embedded in paraffin.
They were then cut into three to five 5-μm-thick sections for each
animal. For cardiomyocyte size measurements, the samples were
stained with haematoxylin/eosin (HE) and Masson trichrome
(MT), as previously described,
12
for the evaluation of interstitial
and perivascular fibrosis.
To quantify cardiomyocyte hypertrophy, about 30 myocytes
were selected randomly per section, at 400
×
magnification, and
digitally imaged. The cross-sectional area of the cardiomyocytes
was measured using Image Pro Plus software (Media Cybernetics,
Carlsbad, CA). Quantitative measurement of the perivascular
fibrosis area was calculated as the ratio of the fibrosis area
surrounding the vessel wall to the total vessel area using
Image Pro Plus software. At least 10 arterial cross sections
were examined per heart. The area of interstitial fibrosis was
identified, after excluding the vessel area from the region of
interest, as the ratio of interstitial fibrosis to the total tissue area.
At least three sections were examined per heart.
For ELISA analyses, blood was collected into tubes containing
heparin from the right carotid artery of the rats and immediately
centrifuged at 1 000
×
g
for 15 minutes. The plasma supernatant
was collected and maintained at −80°C for BNP concentration
determinations, using ELISA assays with a specific BNP kit
(Cusabio).
Statistical analyses
All data are expressed as mean
±
SD. One-way analysis of
variance (ANOVA) was performed to compare the AAC and
sham groups. When the probability value was statistically
significant, a least-significant-difference (LSD)
t
-test was applied
for multiple comparisons. Linear regression analysis was used
to evaluate correlations between LVm by echocardiography
and the actual weights from sacrificed rats. SPSS V19 was used
for statistical analyses. A probability value of
p
<
0.05 was
considered statistically significant.
Results
Fifty rats were initially enrolled in this study. After the surgery
(same day as surgery), the mortality rate for the experimental
pressure overload was 8% (two rats died), and there were no
fatalities in the sham groups. Three days after surgery, 41 rats
remained in the study, including 22 sham controls and 19 AAC
rats. No additional fatalities occurred over the duration of the
experiment.
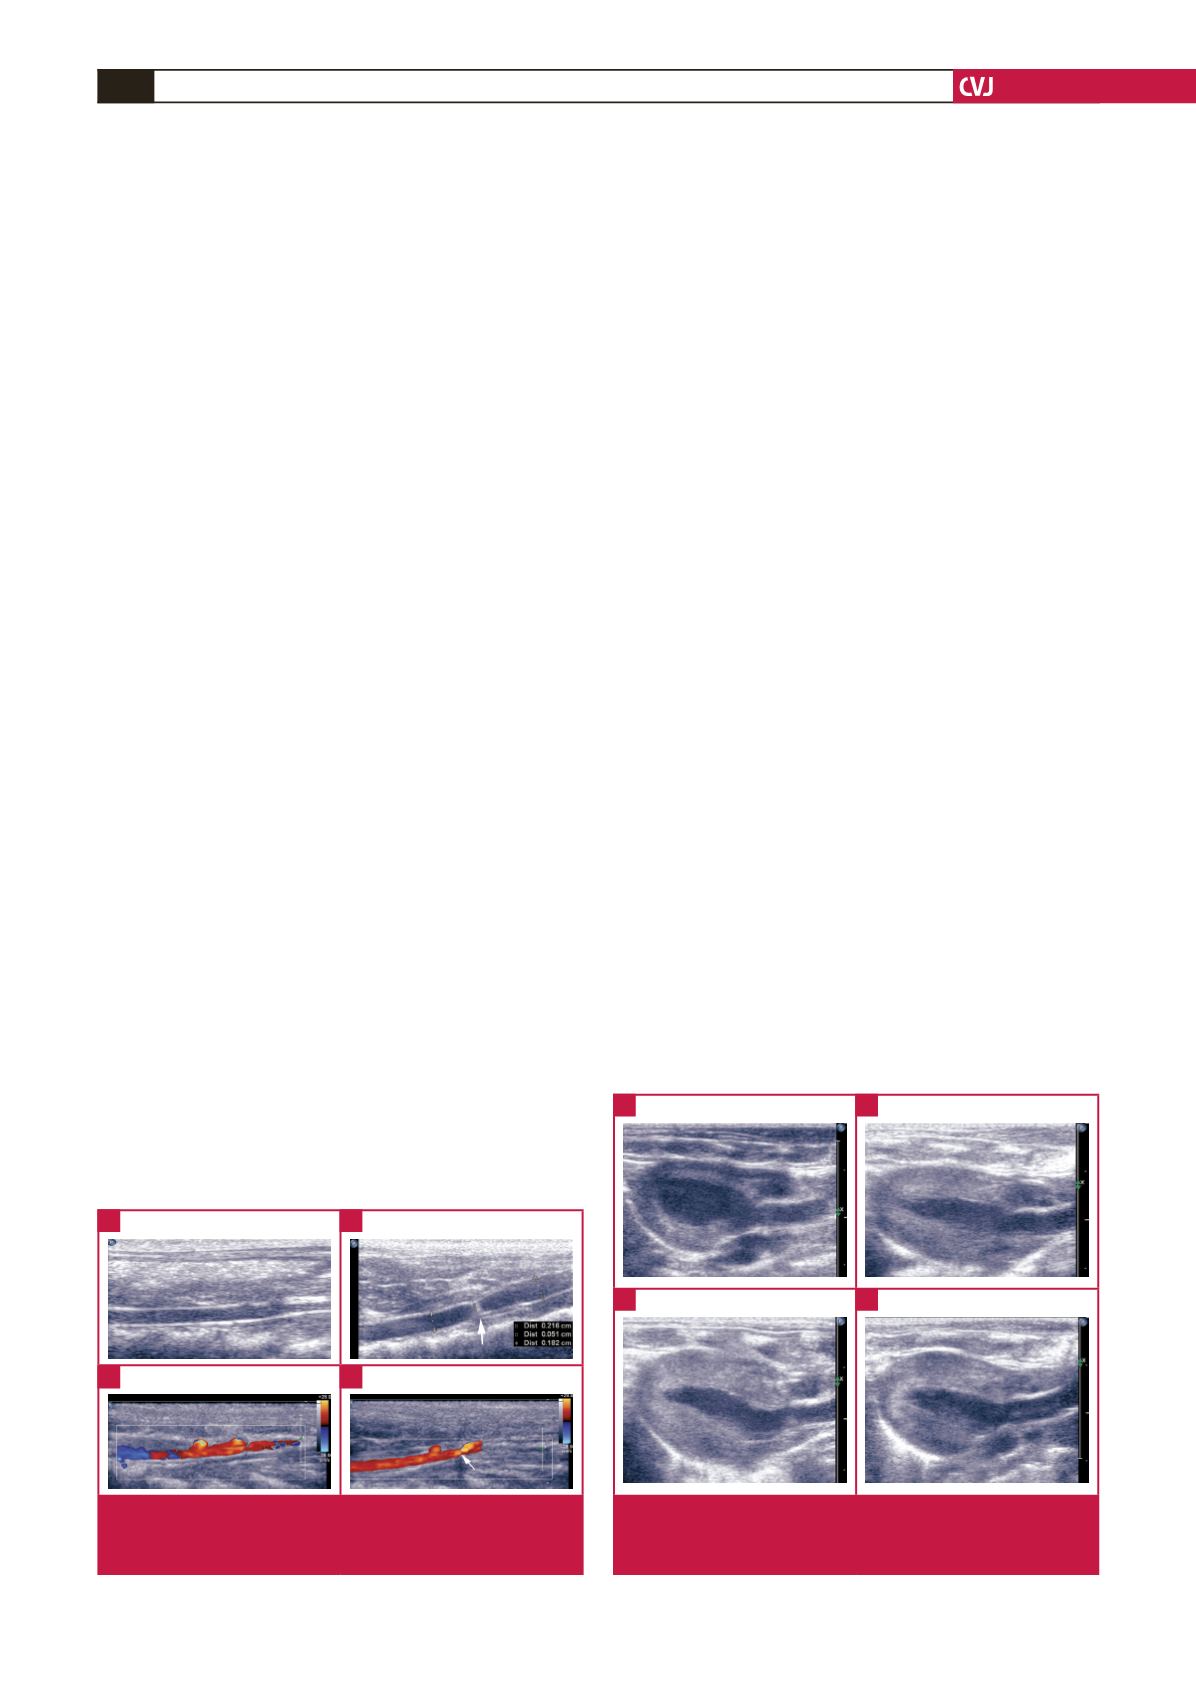
FollowingAAC surgery, the abdominal aortas were constricted
in diameter by 37% (~ 0.06
±
0.01 cm) relative to the aorta,
measured using echocardiography (Fig. 1). Fig. 2 shows a typical
2D echocardiogram of the heart obtained via the parasternal
long-axis view of the LV to compare cardiac structures between
the sham and AAC groups at three, four and six weeks.
Fig. 3 demonstrates the M-mode changes that occurred in the
LVID, IVS and LVPW dimensions during both diastole (Fig.
3A, C, E) and systole (Fig. 3B, D, F), as well as in EDV and
ESV (Fig. 3G, H). IVS (Fig. 3C, D) was significantly increased
Fig. 2.
Parasternal long-axis view of the left ventricle. A: sham
rats at six weeks, B: AAC rats at three weeks, C: AAC
rats at four weeks, D: AAC rats at six weeks.
A
B
C
D
Fig. 1.
Abdominal aortic constriction. A: sham rats, B: AAC
rats, C: sham rats using colour Doppler, D: AAC rats
using colour Doppler.
A
B
C
D